The CLV Activation Playbook: Lens 4, The Purchase Persona Matrix
August 11, 2026
This is the fourth and final post in our series on CLV Activation – a practical guide to turning customer lifetime value predictions into marketing investment decisions that create measurable incremental value. The framework is based on the Value-Based Segmentation developed by Theta from our work building CLV models for hundreds of brands.
CLV Activation Playbook series
Part 1: Introduction to Value-Based Segmentation
Part 2: Lens 1 — Retention & Development Matrix
Part 3: Lenses 2–3 — Value Momentum and Customer Lifecycle
Part 4: Lens 4 — Purchase Persona Matrix (current)
If you are just joining, start with the first post in this series where we introduced the four lenses of value-based segmentation. In the second post, we covered Lens 1, the Retention & Development Matrix, which sets the primary intervention objective for each customer. In the third post, we covered Lenses 2 and 3, which add strategic and tonal context to that objective.
Knowing what to do, why, and in what tone gets you most of the way there. But you also need to know how often to reach out, and what to put in the message once you do. A customer can be a Champion, on a Rising Star trajectory, well past their initial activation window, and still receive the wrong campaign if it does not match how they actually prefer to buy. Lens 4 answers that.
Rules of Engagement: The Purchase Persona Matrix
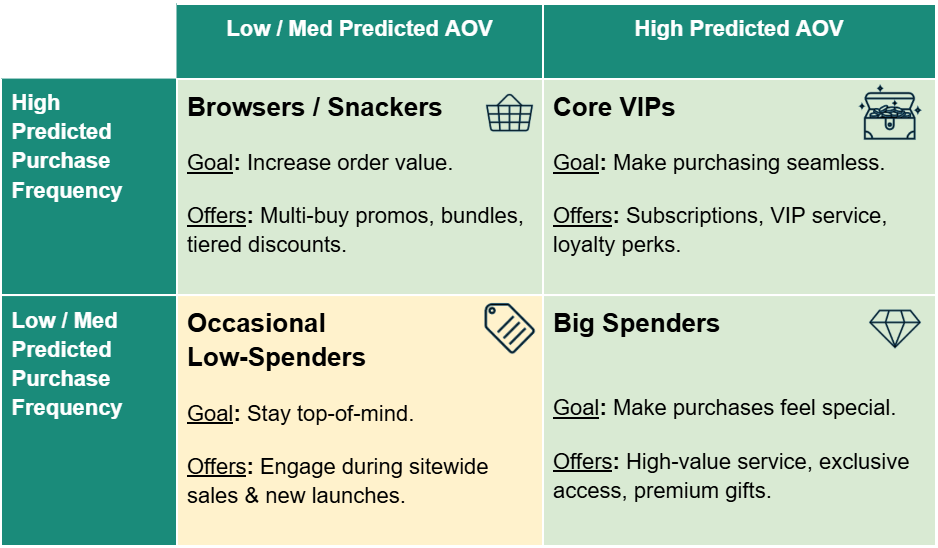
The Purchase Persona Matrix is a 2×2 grid built on two more outputs that CLV Ultra computes for every individual customer: Predicted AOV and Predicted Purchase Frequency.
Predicted AOV
The columns represent future expected transaction size: what the model predicts this customer will spend, on average, the next time they purchase. A customer’s historical spending is only part of this prediction: taken on its own, it misses things that often matter, such as seasonal patterns, broader pricing trends over time, and the way spending tends to shift as a customer’s relationship with a brand matures. A spend model should account for this additional context, so Predicted AOV reflects a more complete picture of what this customer is actually likely to spend next, not just a raw average of what happened before.
Predicted Purchase Frequency
The rows represent expected order frequency: how often the model predicts this customer will transact going forward. Combined with Predicted AOV, this tells you not just how much a customer is worth, but the structure of that value. Two customers can have similar RLV and still generate it in completely different ways, one through frequent, small purchases, the other through occasional, large ones. The right cadence, channel mix, and offer format depend on knowing which is which.
As with the other lenses, these bands are not fixed rules. A reasonable starting point is to set the line at the top decile: customers above it are High, everyone else falls into Low/Medium. The cutoff that actually matters is the one that separates customers who create incremental value as a result of a campaign from those who do not, and the only way to find it is to test.
The Four Segments
The 2×2 grid produces four segments, each defined by a distinct purchasing shape and each requiring a different rule of engagement. As with the seven segments of the Retention & Development Matrix, the goals below are starting points that can (and should be!) refined over time, ideally through experimentation.
1. Core VIPs (High Frequency, High AOV)
Customers predicted to buy often and to spend a lot each time they buy. This is typically your most valuable purchasing structure, and the intervention hypothesis here is to protect and simplify that habit, not interrupt it with constant offers.
Subscriptions are often a promising lever to test in this segment. A customer who already buys frequently and at high value has effectively pre-committed to a recurring relationship, and a subscription can formalize it while also potentially improving your revenue predictability in the process, which is valuable in its own right. Proactive service, a dedicated support line, and non-monetary status perks tend to outperform discounting here. The goal is not to convince a Core VIP to buy. It is to make sure nothing gets in their way.
2. Big Spenders (Low Frequency, High AOV)
Customers predicted to spend well when they buy, but infrequently. The temptation with any high-value customer is to treat them like a Core VIP, but the infrequency changes the right approach substantially.
Because purchases are rare, each one should feel like an event, not a transaction. High-touch service, such as a complimentary consultation, early access to a limited release, or a premium gift with purchase, is the stronger hypothesis to test here, ahead of a straightforward discount. Discounting is worth approaching with particular caution in this segment: a Big Spender who is trained to expect a percentage off will start waiting for the next sale, which converts an already-infrequent purchase cadence into an even less predictable one. We have seen this happen all too many times here at Theta. The goal is to make the rare purchase feel special, not to manufacture urgency that was never there to begin with.
3. Browsers / Snackers (High Frequency, Low/Medium AOV)
Customers predicted to buy often, but in smaller amounts each time. The volume of engagement here is real, but the per-order economics are modest.
The intervention hypothesis is to increase order value without disrupting the frequency that already exists. Multi-buy promotions, bundles, and shipping thresholds are the standard tactics to test, because they are structured to lift the size of an order this customer was already going to place. This distinction matters economically. An offer that a Browser/Snacker would have converted on anyway is not creating incremental value, it is just giving away margin on a transaction that did not need the discount to happen. This is the same subsidy problem we flagged in the Lens 1 post, showing up here through a different lens The tactics that might work best here are the ones tied directly to basket size, not blanket percentage-off promotions.
4. Occasional Low-Spenders (Low Frequency, Low/Medium AOV)
Customers predicted to buy infrequently and to spend modestly when they do. The expected economics of this segment are the lowest of the four, and the intervention hypothesis reflects that directly.
The goal is to stay visible without over-investing. Broad, low-cost touchpoints such as sitewide sale announcements and new collection launches are usually sufficient. Targeted, steep discounts are difficult to justify here on economic grounds, since the expected order value rarely supports the cost of a highly personalized campaign. This does not mean ignoring the segment. It means matching the cost of the outreach to what the segment can realistically be expected to return.
Example: Same Lens 1 goal, opposite tactics.
Let’s say Customer A and Customer B are both Champions under Lens 1: active, with high RLV. Customer A is a Core VIP, buying weekly at a solid order value. Customer B is a Big Spender, buying twice a year at a very high average order value. A subscription offer is likely the right test for Customer A and the wrong one for Customer B, who likely has no interest in a recurring commitment and may even be put off by the ask. A complimentary one-on-one consultation works the other way. It is the kind of high-touch, resource-intensive gesture that makes sense for a purchase happening twice a year, but the economics break down fast as a standing offer for someone buying every week. Same primary objective, but opposite mechanics.
Bringing All Four Lenses Together
With Lens 4, the framework is complete. Each lens answers a distinct question, and together they take a customer from an abstract prediction to a fully specified intervention.
Consider a customer who is an At-Risk VIP under Lens 1, a Fallen Angel under Lens 2, an Established Repeat Customer under Lens 3, and a Big Spender under Lens 4. Lens 1 tells you this customer is a top retention priority. Lens 2 tells you not to lead with an offer. Diagnose the decline first. Lens 3 tells you the message should acknowledge a real history with the brand, not read like a first-touch acquisition email. Lens 4 tells you that when an offer is eventually made, it should be a single, high-value gesture and not a discount-driven, multi-touch campaign.
Four lenses, one customer, one intervention. This is what value-based segmentation makes possible: a systematic, testable way to decide who gets what, and why, rather than a personalization layer applied on top of marketing as usual.
If you are not already using predictive CLV metrics to guide segmentation and activation, reach out to us at ThetaCLV.com – we would love to show you what’s possible.
Theta’s CLV Ultra model gives brands individual-level predictions for every customer – RLV, pAlive, predicted AOV, predicted purchase frequency, and more. The CLV Activation Playbook, developed by Theta, translates those predictions into a practical segmentation and activation framework.