The CLV Activation Playbook. Lens 1: The Retention & Development Matrix
May 6, 2026
This is the second post in our series on CLV Activation – a practical guide to turning customer lifetime value predictions into marketing investment decisions that create measurable incremental value. The framework is based on the Value-Based Segmentation developed by Theta from our work building CLV models for hundreds of brands.
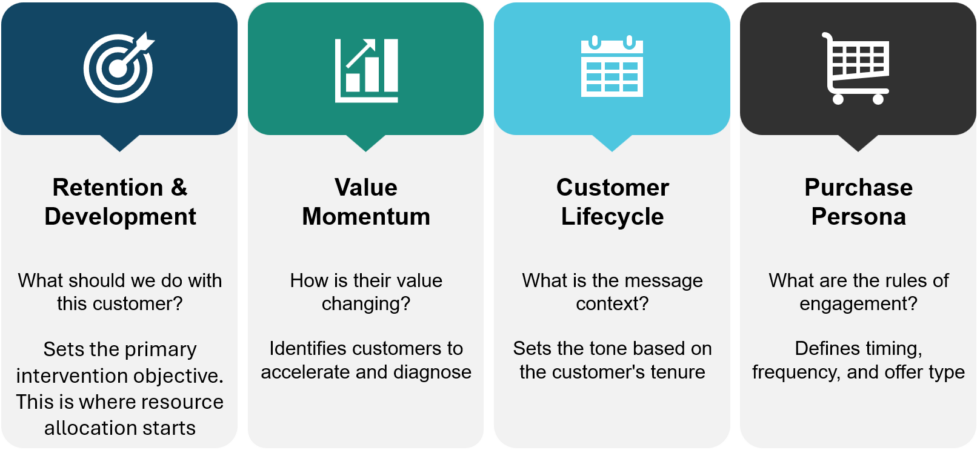
In the first post in this series, we introduced value-based segmentation as the operational answer to a deceptively hard question: what do you actually do with each of your customers? We laid out four lenses that work together to take you from a general marketing objective to a specific, economically disciplined intervention, with ROI explicitly in view.
The first job of CLV activation is not simply personalization. It is deciding where intervention is economically justified. Some customers may warrant high-touch retention. Some may warrant automated nudges. Some may be better left alone (at least for now). The Retention & Development Matrix turns that allocation decision into a customer-level map.
This post is about Lens 1: the Retention & Development Matrix. This lens is “Mission Control” because it answers the most fundamental activation question first: what should we do with this customer? Before you think about tone, trajectory, or offer type, you need to know the primary intervention objective. Retain them? Develop them? Win them back? Or stop spending on them entirely?
The matrix answers that question for every customer in your database, turning CLV predictions into a resource allocation map.
Mission Control: Retention & Development Matrix
The Retention & Development Matrix is a 3×3 grid built on two outputs that CLV Ultra, Theta’s CLV model, computes for every individual customer in your database: pAlive (Probability of Being Alive) and Residual Lifetime Value (RLV).
Probability of Being Alive
The rows of the matrix represent relationship state. In non-subscription businesses, such as retailers, DTC brands, and other settings where there is no formal contract governing when a customer buys, this is measured using pAlive, or Probability of Being Alive. pAlive is the model’s estimate of the probability that a customer has not churned and will make another purchase at some point in the future. In subscription businesses, churn is observed directly, which allows it to be modeled more explicitly. The matrix logic still applies, but the measurement details differ.
To understand why this matters, start with how most companies currently make this call. The standard approach is a fixed inactivity threshold: for example, anyone who hasn’t purchased in 90 days gets a win-back email, anyone past 180 days gets suppressed. It feels systematic. But it ignores something basic about how customers actually behave: they each have their own internal purchasing cadence.
Example: Why fixed recency rules fail.
Consider two customers who have not purchased in 90 days. Customer A typically buys every 45 days and has high expected future value. Customer B buys twice a year and has low expected future value. A fixed win-back rule treats them the same. The Retention & Development Matrix does not. Customer A may justify immediate retention investment. Customer B may justify no intervention beyond low-cost owned channels. The difference between a good retention program and a bad one is often not the email creative; it is whether the customer actually needed retaining in the first place.
Getting this wrong is expensive, and the costs run in both directions. Trigger a retention offer too early, before a customer is actually at risk, and you give away margin to someone who would have bought anyway. The campaign may look like it is working, but you have not retained anyone; you have subsidized a purchase that was likely to happen without the intervention. Wait too long, and the customer may already be gone. At that point, even a rich offer may not create enough incremental value to justify its cost.
Catching a customer at the economically relevant moment is what pAlive enables. Rather than applying a fixed calendar threshold, the model looks at each customer’s individual purchase history, infers their natural buying rhythm, and estimates the probability that the relationship is still alive. The result is earlier flagging for customers whose silence is unusual, and fewer false alarms for customers who are simply on a slow cadence. Retention offers create incremental value only when they reach customers who need retaining and when the expected lift exceeds the intervention cost.
The three engagement tiers are:
- Active. pAlive above roughly 60%. This customer is likely still in a buying relationship with you.
- At-Risk. pAlive between roughly 30% and 60%. The relationship may be weakening. There may still be a window for intervention, but the economics and timing should be tested.
- Lost / Hibernating. pAlive below roughly 30%. The customer is unlikely to still be in an active buying relationship. Action is usually warranted only when the expected economics justify it.
The optimal cutoffs between these tiers are those that maximize the incremental value from your retention efforts, and the best way to find them is to run experiments: test slightly different pAlive thresholds, measure the ROI of the resulting campaigns, and adjust accordingly.
Residual Lifetime Value (RLV)
The columns of the Retention & Development Matrix represent a customer’s predicted future value, measured by RLV, or Residual Lifetime Value. RLV is CLV Ultra’s best estimate of the revenue or (ideally) profit we expect from this customer going forward, conditional on the customer’s observed history and absent any specific new intervention. It is not a statement of what the customer could be worth under an idealized campaign. It is our best baseline prediction of what we expect to happen next.
That baseline can be distorted if the model fails to account for timing. A customer who comes back during a seasonal period may not have a permanently higher baseline purchase rate. Tenure effects, calendar effects, and campaign timing can all make a customer look better or worse than their durable relationship with the brand would imply. CLV Ultra is designed to separate those effects from baseline customer quality, so RLV reflects expected future value rather than a simple reading of recent behavior.
RLV is the metric that makes resource allocation genuinely customer centric. Your marketing investments should be proportional to the future incremental value an intervention can plausibly create. RLV gives you the baseline: the value CLV Ultra predicts from this customer without a specific new intervention. The goal of your campaigns is to test whether an intervention can lift that baseline, net of cost.
pAlive and RLV are complementary. pAlive describes relationship state. RLV describes expected value conditional on history. A customer with low pAlive and high RLV means the model is still predicting meaningful future value from the customer, usually because prior behavior was strong enough that even a lower probability of being alive leaves material expected value in the tank. If an intervention can increase the probability that the relationship continues, the incremental value created may be attractive, but that uplift should be tested and not assumed.
Value tiers are not fixed rules. Start with a sensible default, such as top decile for High RLV, median to top decile for Medium, and below median for Low, then run small-scale experiments to find the cutoffs that best separate customers whose retention ROI is positive from those where it is not.
Together, these two axes produce a map of where different levels of intervention are more or less likely to be economically justified.
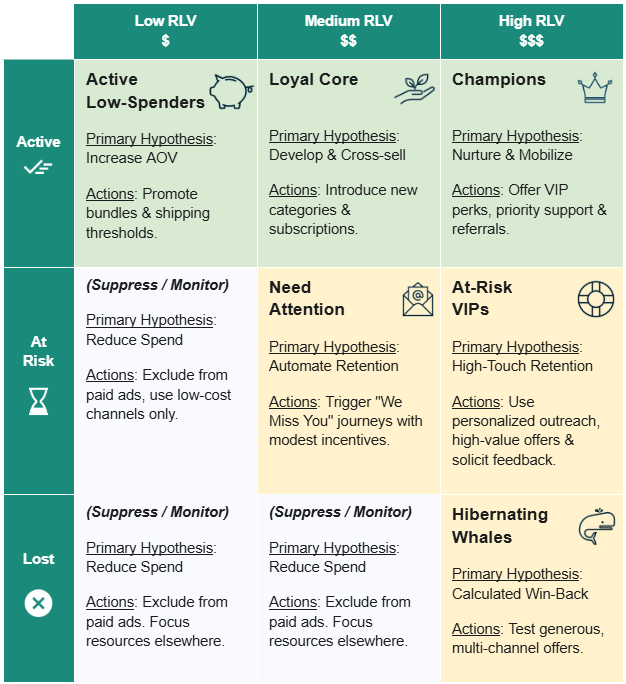
The Seven Segments
The nine cells of the matrix collapse into seven named segments, each with a distinct primary intervention hypothesis.
These goals are starting hypotheses, not universal prescriptions. The matrix tells you where different levels of intervention are more or less likely to make economic sense. The exact channel, offer, timing, and creative still need to be tested within the context of each business.
1. Champions (Active, High RLV)
Your best customers. Their relationship appears alive and their expected future value is in the top 10%.
The instinct here is often to leave them alone, or to keep selling to them aggressively. Both can be mistakes when applied blindly. The usual objective is to nurture and mobilize, while still testing development opportunities where the economics support them. Consider differentiated treatment that protects the relationship: early access to new products, priority service, or recommendations that reflect their actual purchase history rather than a generic campaign calendar.
Champions can also be a credible source of referrals, reviews, and social proof. Test mobilization strategies here because the customer relationship is already strong.
2. Loyal Core (Active, Medium RLV)
These are your reliable, repeat customers. Not your top 10%, but consistently active and with meaningful expected future value. They are your sustainable engine.
The goal here is often development: testing cross-sell, category expansion, replenishment, subscription, or loyalty structures that can increase expected value without over-investing. These customers already trust you. The question is whether additional investment can deepen that relationship profitably. This does not mean cross-sell is off-limits for Champions. It means Loyal Core customers often have meaningful room for profitable development and may be a cleaner place to test these programs without over-touching the very top tier. A loyalty program can also fit here when the economics support it, especially when it consolidates repeat behavior that already exists rather than trying to manufacture loyalty from scratch.
3. Active Low-Spenders (Active, Low RLV)
Active customers, but with low predicted future value. They keep buying, but the expected economics are modest.
The goal is to efficiently increase AOV without over-investing. Lightweight, automated tactics are usually the starting point: dynamic free shipping thresholds, bundles that increase cart size without a targeted campaign, or low-cost merchandising tests. The emphasis is efficiency: capture slightly more value from each transaction without adding much intervention cost.
4. At-Risk VIPs (At-Risk, High RLV)
This is often one of the most urgent segments in the matrix.
These are customers with the highest expected future value who are showing signs of lapsing. The window to retain them may still be open, but it may not stay open long. The goal is to test higher-touch retention, with intervention cost calibrated to the expected value at stake.
Generic win-back emails may be too blunt for this segment. Because the expected value is high, this is a natural place to test richer interventions: outreach that feels more individual, offers calibrated to expected value, and mechanisms to learn why the customer may be lapsing. A one-question survey can reveal context the model cannot observe, and it can help distinguish customers who need a better offer from customers whose needs have changed.
Everything about the At-Risk VIP intervention should be designed to answer an economic question: can a higher-cost retention effort preserve enough expected value to earn a return?
5. Need Attention (At-Risk, Medium RLV)
At-risk customers with medium expected future value. Worth retaining in many businesses, but usually not worth the high-touch investment you would make for a VIP.
The goal is automated retention with economic discipline: enough personalization to matter, not so much cost that the segment stops being profitable. A triggered multi-step email/SMS journey is a common starting point. Test modest incentives, such as a small discount or free shipping, to see where ROI peaks. The key word is automated: relevant enough to affect behavior without manual effort that overwhelms the economics.
6. Hibernating Whales (Lost, High RLV)
High-value customers who have likely churned. This is typically the Lost segment most likely to justify active pursuit. It is worth making the timing point explicit: every Hibernating Whale was an At-Risk VIP at some point. A Hibernating Whale is, in many cases, an At-Risk VIP whose intervention window was missed. The goal is a calculated win-back. These customers have demonstrated significant historical value, and their RLV suggests that meaningful expected value may remain despite low pAlive. The economics of a successful win-back can justify a more generous offer and a multi-channel test. Email alone may not reach them if they have stopped opening your messages. Social retargeting, direct mail, or a combination of channels may be worth testing when the expected value justifies the added cost.
The word “calculated” matters. Test your win-back offers before scaling. A 40% discount that produces a strong win-back rate but no repeat purchases afterward is not a success. You are trying to restart a relationship, not buy a single transaction.
7. Suppress / Monitor (At-Risk Low RLV; Lost Low and Medium RLV)
This includes At-Risk Low-RLV customers and Lost customers whose Low or Medium RLV does not usually justify active reactivation spend. It does not include Need Attention, which is At-Risk with Medium RLV and remains a candidate for automated retention testing.
The goal is to reduce paid and high-cost marketing where the expected economics do not justify the intervention. These segments are good candidates for ad-platform suppression lists and exclusion from targeted paid campaigns. Keep them on a broad email newsletter if you have one, but avoid meaningful spend on customers whose predicted future value cannot support it. Reallocate that budget toward At-Risk VIPs, Champions, and Loyal Core customers, where the expected return is more likely to justify investment.
This is often the most counterintuitive part of a value-based segmentation program. Marketers are trained to pursue re-engagement. But a truly customer-centric strategy is just as deliberate about where it does not invest. Suppressing economically weak audiences can improve campaign ROI by reducing spend where the expected return is weakest.
Coming Up Next
In Part 3, we will cover Lenses 2 and 3 together: Value Momentum and Customer Lifecycle. Once you know the primary intervention objective for each customer, these two lenses help determine how to engage: what strategic approach fits the way their expected value is changing, and what tone fits their relationship with your brand. We will introduce Rising Stars, Fallen Angels, and the lifecycle stages that should be shaping your messaging.
If you are not already using predictive CLV metrics to guide segmentation and activation, reach out to us at ThetaCLV.com — we’d love to show you what’s possible.