Warby Parker: While the Stock Pendulum Swings, the Unit Economics Hold Steady

Written by: Hallie Gu, Val Rastorguev, Daniel McCarthy and Peter Fader | July 2022 | CBCV Analysis
(See August 19, 2022 update at the end of this original post)
Introduction: Warby Parker’s performance since the IPO
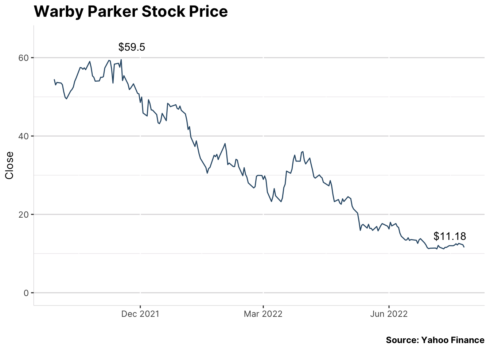
Warby Parker went public via a direct listing on September 29, 2021, opening at $54.05 per share, or an implied valuation of over $6 billion. At the time, we used Theta’s Customer-Based Corporate Valuation® (CBCV) methodology – an extension of the methodology summarized in our Journal of Marketing Research article – to infer how strong Warby Parker’s unit economics were and to estimate the fair value of its equity. Our conclusion was that despite Warby Parker’s strong unit economics, our estimate of the fair valuation of their equity was about $2.5 billion (or $22 per share), less than half of its market value at the time.
Our initial analysis turned a lot of heads, generating a significant amount of media attention, including mentions in Bloomberg, CNBC, Forbes, Retail Brew, and many others. However, our somewhat dim outlook on the stock price raised some eyebrows: “But they are ramping up their contacts business! But revenue is about to explode as their stores fully reopen again!” And so on.
Our caution appeared to have been justified, as Warby Parker’s stock fell sharply after their offering – it plummeted to our fair valuation estimate of $22, then fell well below it. But now the stock is trading at about $11, almost half of what we had said it was worth. Where does that leave us? Is their stock undervalued?
To answer these questions, we ran a more current CBCV analysis on the company using data up to and including Q1 2022 results reported in May. Through this new deep dive, we updated our model to account for their financial performance since our last analysis.
Long story short, those developments led us to revise our fair valuation estimate slightly downwards. Our revised valuation is $2.4 billion ($21 per share), or 5% less than what we had previously estimated. Even though our valuation remained virtually the same, a few offsetting factors impacted it directionally, which we will discuss in the “Valuation” section below.
Context Setting
Before diving in, we thought it would be instructive to summarize changes in Warby Parker’s performance since the direct listing in order to get a high-level understanding of how the company has been doing.
Net sales expansion: Warby Parker has been able to grow its net revenue in recent years, generating $371 million, $394 million, and $541 million in 2019, 2020, and 2021 respectively. In Q1 2022, Warby Parker generated $154 million in net revenue, 10% more than the $139 million the company generated in Q1 2021. In recent filings, Warby Parker attributes the increase in net revenue to a number of factors, including an increase in orders from their larger active customer base, an increase in AOV driven by more expensive product mix which increased average price per order, and a slight increase in average units per order.
Active customer growth: Active customers grew from 1.8 million in 2020 to 2.2 million in 2021, a 22% increase. Warby Parker cited active customer growth as a key driver of net revenue growth from 2020 to 2021.
Store count growth: WRBY has been able to expand its retail footprint since the IPO. Store count increased from 126 at the end of 2020 to 161 at the end of 2021. It further increased to 169 as of the end of Q1 2022.
Widening net loss: Warby Parker reported zero net loss in 2019, and its net loss has since widened to $(56) million in 2020 and $(144) million in 2021. While Q1 2021 saw net income of 2.2% of net revenue, WRBY experienced a net loss of 22.3% of net revenue in Q1 2022. The increase in net losses can be attributed to rising operating costs that were only partially offset by rising net revenue. In the near term, Warby Parker expects to continue incurring increased operating costs and generating net losses in order to retain customers, expand its retail footprint, enhance its product and service offerings, and potentially expand into new international markets.
Increasing SG&A cost: A key driver of increasing net loss is SG&A. While net revenues increased by 37% from 2020 to 2021, SG&A increased 61%! According to recent filings, the increase was primarily driven by higher compensation costs from growth in the workforce, increased marketing costs accompanying continued investment in performance marketing and the Home Try-On program, cost associated with the direct listing, and charitable expenses incurred in August 2021.
The Data: what customer metrics were disclosed and not disclosed in recent filings
Prior to Warby Parker’s direct listing, the company filed its Form S-1 with a rich set of customer-related disclosures, including quarterly active customer counts, cumulative customers acquired (from which we were able to infer new customer counts), customer acquisition costs, yearly total orders, average order value, and annual sales retention by cohort. We were able to make use of these customer metrics along with financial data disclosed in the filing to model Warby Parker’s customer behaviors using our Customer-Based Corporate Valuation® methodology. Since the direct listing, Warby Parker has filed two 10-Qs and one 10-K, and we were hoping – praying – that the company would continue to disclose more customer data than your average publicly traded DTC company.
In this regard, we were a bit disappointed.
The filings mentioned improvements in a number of areas, including rising AOVs and increasing number of orders. However, the only customer-related data point Warby Parker continued to disclose was the active customer count as of the end of 2021 (2.2 million). We were able to update our model with this new data point in conjunction with traditional financials, but we had hoped to see more customer-related disclosures. Given how many non-subscription companies disclose active customer counts and total orders on a regular basis, we believe these measures should have been disclosed at the very least. Still, what was disclosed in the S-1, in conjunction with the new customer disclosures and qualitative commentary from the management team (and the net revenue data) were enough for us to have confidence in our model’s projections.
The model: how our model performed and what we updated
Consistent with the CBCV framework, we modeled the flow of customer acquisitions over time, how long those customers remain with the firm after acquisition, the number of transactions made while they are “alive,” and the amount they spent on those orders. Model parameters were estimated so that model-implied data aligned closely with the actuals disclosed in the S-1, and as we had shown in the original analysis, model fits were quite good. With new data points as recent as Q1 2022, we saw that, for example, our original model forecasted Q1 2022 net revenues to be $157 million, which ended up being within 2% difference of the $153 million the company actually generated, a testament to the model’s robustness and accuracy in revenue forecasting.

As robust as the original model was, the specifications were quite simple: we had included a single covariate to account for the adverse impact of COVID on the acquisition and repeat purchasing processes; for the spend model, we included two covariates to allow spend to trend in calendar time (consistent with AOV growth) as well as with respect to a customer’s tenure.
In our updated analysis, we leave all model specifications unchanged except for how we handled COVID, based upon new data about COVID’s impact on Warby’s business. While we had originally assumed that customer behaviors would return to pre-COVID baselines after 2020, more recently disclosed data has led us to believe that COVID set a “new normal” for customer acquisition. Put simply, a model that tells this revised unit economic story fits a lot better than one that had COVID’s impact shutting off after 2020.
After refitting the model with newly disclosed data, we project future revenue per acquired customer over their lifetime to understand the health of Warby Parker’s unit economics. We then combine future expected revenues from existing and future customers, account for various cost items, and build a complete CBCV model to arrive at a fair valuation of Warby Parker’s equity. In the upcoming section, we will dive into how unit economics and valuation changed in the refresh analysis, as well as the drivers behind these changes.
Unit Economics: key assumptions
Before diving into key takeaways, it’s important to lay out other assumptions that go into the calculation of unit economics results. In order to estimate Warby Parker’s contribution profit-based post-acquisition value, we must first estimate variable cost margin. The S-1 filing included a chart breaking down Warby Parker’s variable costs into COGS, customer acquisition cost, and selling and service cost per customer:
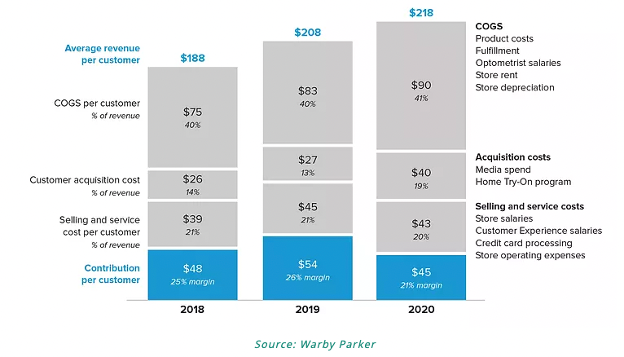
Since the company has not explicitly updated this chart since the S-1 (except for COGS, separately), we make the following assumptions:
- COGS: COGS stays relatively constant from 2018 to 2021, so we assume the same percentage – 40% going forward.
- Selling and service cost per customer: this expense remained relatively flat at 20% from 2018 to 2020, which we assume going forward.
- Customer acquisition spend per customer: while Warby Parker deducts customer acquisition cost when calculating the contribution margin, we do not account for it in the same way. This expense – media plus home try-on costs – is partly (we estimate 80%) an acquisition expense and partly (we estimate 20%) a driver of repeat orders. We treat the acquisition portion of this expense separately as true customer acquisition cost (CAC), and the proportion that drives repeat orders is subtracted from the variable margin. As a result of this, we estimate that media and home try-on costs lower the variable margin by 6% of revenue on a go-forward basis.
Second, since CLV, as we define it, is calculated as PAV minus CAC, it is important to get CAC right. As part of our previous analysis, we estimated CAC to be $55 per customer in 2020 based on actual data reported in the S-1. Unfortunately, CAC figures for 2021 and 2022 have not been disclosed since then, so we estimated CAC at $61 per customer in 2021 and $63 in 2022, assuming total acquisitions coming from our customer acquisition model and total acquisition spend as a percentage of yearly net revenue remaining constant at the 2020 level. As we have expressed in the “The data” section of this note, we would have liked to see CAC disclosures in recent reports and overall continued transparency as established by the company’s very first S-1 filing with the SEC.
Lastly, the rate at which to discount future expected revenues is important as well. We previously used a 11% annual discount rate based on WACC’s of comparable online retail companies with a brick and mortar component. We now use 9.9%, as this is Warby Parker’s most recently updated WACC on Bloomberg.
Unit Economics: metrics and takeaways
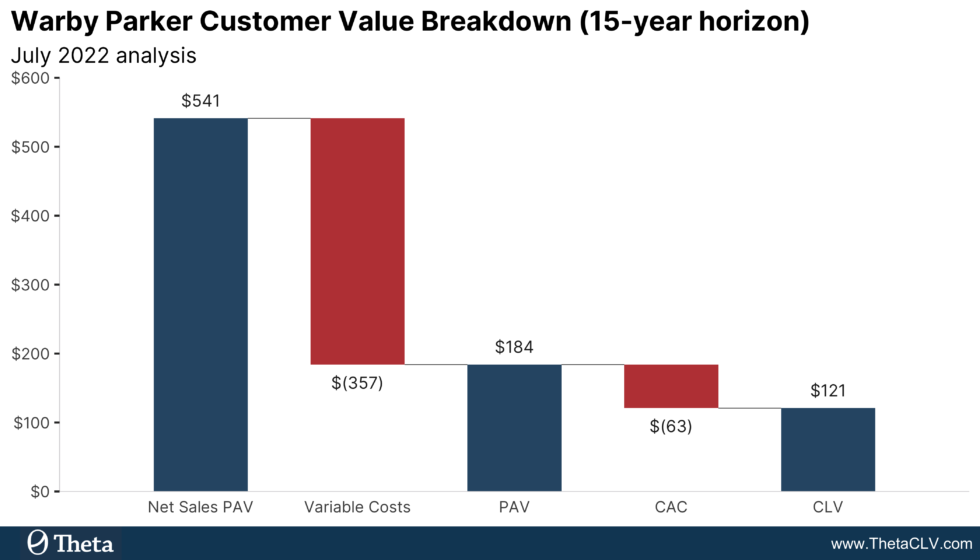
Using the variable cost assumptions above and a 9.9% discount rate, we estimate that the post-acquisition value of a customer acquired in March 2022 (the most recent acquisition cohort at the time of Q1 2022 filing) is between $128 and $184. We provide a range in lieu of a single point estimate because (1) we infer that customers continue coming back consistently over multiple years, and (2) the range takes into account our belief that this strong consistency will carry on for somewhere between 5 and 15 years. We believe this admittedly “manual override” is a reasonable one, but ultimately is an assumption that we are making. One thing is for sure – we can’t use an indefinite horizon because doing so will imply a material proportion of customers will be placing orders regularly ad infinitum…
After subtracting CAC of $63 (our estimate of the corrected CAC per customer in 2022), Warby Parker customer’s contribution-profit-based CLV is between $65 and $121, implying a return on CAC of between 103% and 191%, or equivalently, a PAV to CAC ratio of between 2.0x and 2.9x. PAV to CAC is a key unit economics metric that we focus upon as a measure of absolute and relative performance in all of the diligences we have ever analyzed. The median for 15-year PAV to CAC ratio in our database is 3.6x, and Warby Parker’s ratio of 2.9 is around the 45% percentile – okay, but not the best.
Now that we’ve laid out unit economics metrics for the most recent acquisition cohort, it is helpful to compare these results with an older cohort to understand cross-cohort trends. June 2021 was the most recent acquisition cohort at the time of Warby Parker’s IPO, so let’s compare the figures we obtained above for the March 2022 cohort to it. Using our refreshed model, we estimate the contribution profit-based PAV for the June 2021 cohort to be between $127 and $183. After subtracting the acquisition cost of $61, CLV is between $66 and $122, implying a return on CAC of between 108% and 199%, or PAV to CAC ratio of between 2.1x and 3.0x. In other words, the figures for the June 2021 cohort are roughly the same as those of the March 2022 cohort, except for a slight increase in CAC for the more recently acquired cohort. These refreshed figures for the June 2021 cohort are also almost exactly the same as what we had estimated for this same cohort in our previous analysis, implying stability across model runs as well as across cohorts. Valuation: assumptions and results
As we had done in our previous analysis, we generate revenue forecasts using the probability models of customer behavior, apply future margin and capex assumptions to translate revenues into free cash flows, and estimate the fair valuation of Warby Parker’s equity using a DCF approach. In addition to updating the probability models based on the latest data, we have also revised a few of the financial assumptions. In particular, we consulted Cowen Research on their future financial assumptions and updated our DCF model accordingly. Below is a summary of main financial assumptions we used in this analysis:
| Assumptions | Current Level | Target Level |
| Gross Margin | 60% of net sales in Q1 2022 | 63% in 10 years |
| Marketing Spend | 19% of net sales in 2020 | 12% in 4 years |
| G&A | 67% of net sales in 2021 | 30% in 9 years |
| CapEx | 9% of net sales in 2021 | 2% in 9 years |
| WACC | 9.9% as estimated by Bloomberg |
Under the assumptions outlined above, our base case valuation of Warby Parker’s equity is at $2.4 billion, or $21 per share. The valuation is slightly lower than our IPO analysis, where we valued Warby Parker’s equity at $2.5 billion, or $22 per share. That said, it is still well above the aforementioned $11 at which the company is currently trading. In other words, if our analysis is correct, Warby Parker is trading at an attractive valuation with meaningful upside potential right now.
A few factors contributed to this adjustment in valuation – some positive and others negative – effectively canceling each other out.
- (–) First, we lowered our acquisition projections due to the lingering COVID impact as mentioned in the unit economics section. This decrease in future acquisitions also lowered revenue forecasted, thereby driving future cash flows downwards.
- (–) Second, G&A increased from 54% of net revenues in 2020 to 67% in 2020, which not only impacted profits in 2021, but also led us to adjust upward our target G&A level in future cost margin forecasts. We increased the target to 30% of net revenues given the recurring nature of main G&A expense items in 2021. Note that the assumption is still in line with comparables, as Warby Parker’s main competitors, many of whom may have more expansive physical store footprint, incur G&A overheads of 30-34% of revenues.
- (+) Lastly, using Cowen’s directional assumptions for gross margin and CapEx led to more favorable cash flow forecasts, on the margin, but would not change the main conclusion of our analysis that the current valuation appears to be cheap. Compared to our previous analysis, the gross margin target is now higher and CapEx target lower, both contributing to an increase in Warby Parker’s equity valuation. But even if we had left our previous assumptions as they were, our estimate of Warby Parker’s fair valuation would have been $2.0 billion, or $18 per share, which is still well above where the company’s stock price is trading at right now.
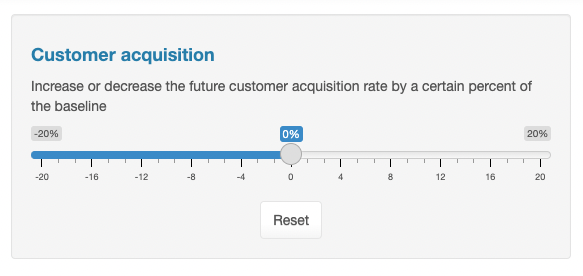
Noting that the valuation is sensitive to various assumptions, including G&A and WACC, we encourage you to adjust these parameters, among many other customer and financial parameters, in the valuation simulator to see what it implies for Warby stock price under your own set of assumptions.
Conclusion
In summary, our updated analysis of Warby Parker shows that our prior revenue predictions were highly accurate, and that the company’s unit economic health is more or less the same as what we had inferred when we last analyzed them, which is a testament to the robust nature of our probability models, and the strength of Warby Parker’s customer base. That said, we do infer customer acquisition growth is less than and SG&A more than what we would have predicted. Netting it all out, our fair value estimate has come down a little bit, but not much – not nearly as much as the stock price has come down. As a result, even when we assume relatively conservative assumptions about future growth and margin potential, the stock still seems attractively priced to us.
Of course, you may be wondering – what about the recession? Yes, the recession will likely change buyer behavior in coming months, and is something we easily can, have, and likely will, incorporate into our model once the data from Q2 2022 and onwards become available. We have incorporated recessions into past analyses and have seen the sort of dynamics you would likely expect – customers adopting more slowly, customer churning more quickly, and the like. However, while these covariates can help capture all the wiggles and jiggles in the data, their impact on overall valuation can be more limited than you might think. For example, in the aforementioned prior analysis, when we zeroed out the impact of the great recession, effectively pretending that it never happened, the valuation expansion was trivially small. So the big question here is this: will this recession fundamentally change the baseline for Warby Parker’s business, or is it a business cycle fluctuation? If it is the latter – which we believe it is – then even if the recession was severe, our prior work would suggest that the overall valuation consequence will be similarly small. Notch our valuation by 10% even, and the conclusion we reach is still the same.
Until our next update on the analysis, we would encourage you to play around with different scenarios in the simulator. As alluded to earlier, we hope that Warby Parker discloses a bit more customer data, as that will allow all investors – not just us – to better understand how well the company is doing especially in the recession we now face.
Updated Analysis: August 19,2022
Warby Parker released its Q2 2022 results earlier this month, shortly after we had released our updated analysis. Rather than piecing together a new standalone analysis, we are adding it here as an addendum to that earlier work.
Before diving into customer economics and valuation, these were the major highlights from the quarter:
- Maintenance of stable gross profit margin in the 58% to 60% range.
- Increase in store and active customer counts relative to the same period in 2021. As of the end of June 2022, store count is at 178, a 23% increase since 2021, while total active customers over the same period rose by 9% to 2.26M.
- Moderating EBITDA margin. For the quarter ending June 30 2022, Warby Parker’s EBITDA margin fell to 4% from 8.2% in the year earlier period.
Of course, the two big questions for us are (1) how did our predictions from the prior analysis hold up this quarter, and (2) did the underlying health of the business, as viewed through the lens of CBCV, change, and if so by how much and in what direction?
Starting with question 1, the results were heartening. Once again, the model validated well out-of-sample. Our model last quarter had predicted net revenue to be $153.3M in Q2 2022, which ended up being only 2.5% higher than the $149.6M the company actually generated this past quarter. Moving to question 2, we then refit the model on all the data, inclusive of the new information disclosed in Q2, and found that the parameter estimates and unit economics remained stable, consistent with our July analysis. Aligning almost exactly with the previous analysis, we estimate that the post-acquisition value of a customer acquired in June 2022 (the most recent acquisition cohort at the time of Q2 2022 filing) is between $129 and $184 for a 5-year and 15-year forecasting period. After subtracting CAC of $63, Warby Parker customer’s contribution-profit-based CLV is between $66 and $121, implying a return on CAC of between 104% and 191%.
As mentioned in our previous commentary, we provide a range for what we believe PAV and CLV to be. We do this because we believe that customers will continue their relationship with the company over multiple years, but the available data sheds little light as to when this will slow down and eventually stop. This range aligns with our belief that customer relationships will last for somewhere between 5 and 15 years– it is an assumption, or “manual override”, we have to make in the absence of outside information. The choice for this range is based on norms we have seen from other CBCV analyses we have performed. Now, for situations where we need to rely on predictions that extend far beyond the range of our data, such as the DCF model for Warby Parker’s equity valuation, it would be logical to apply a similar manual override. We did not do so in our previous analyses, which was one reason why we initially felt so strongly that WRBY was overvalued at the time of its DPO. Even when we over-optimistically assume that customer relationships will extend further than is reasonable, we still could not arrive at a valuation that justified what the company stock had been trading at. But now that the pendulum is swinging in the other direction, it makes more sense to make more realistic, conservative assumptions. If we infer the company is undervalued, using conservative assumptions about customer longevity (and margins), we can have more conviction about our conclusions.
To bring this to life through our model, we assumed that customers would not live longer than (and thus contribute to WRBY’s revenue after) 10, 15, or 20 years. Without imposing any such assumptions upper bounding the longevity of customers in the model, we estimate the fair valuation of Warby Parker’s equity to be $2.5 billion or $22 per share, nearly identical to our prior analysis using data through and including Q1 2022. However, when we assume that customers will not live longer than 10, 15, or 20 years, our fair valuation falls to $14, $17, or $19 per share, respectively. In other words, even with more conservative assumptions about customer lifetimes, we still infer the stock to be attractive at $14 per share as of this publish date.
Time will tell, but we were cautiously optimistic when WRBY was trading at $11 (which prompted our prior analysis), and we continue to hold this sentiment at $14 after the Q2 results.
This article is for informational and educational purposes only. You should not construe any such information or other material as investment, financial, or other advice. Nothing contained in this article constitutes a solicitation, recommendation, endorsement, or offer by Theta to buy or sell any securities or other financial instruments.