Warby Parker – strong fundamentals, but tough to justify a high valuation

Introduction
In our previous piece of the series on Warby Parker, we assessed the company’s unit economics by analyzing the financial and customer-related metrics disclosed in its S-1 filing with the SEC. We concluded that Warby Parker has healthy unit economics despite low repeat purchase rate because the company has relatively high contribution profitability per order relative to their customer acquisition cost (CAC), and exceptionally consistent monetization after acquisition. Specifically, we estimated that the average post-acquisition value (PAV) of a recently acquired customer is $125-$176, with an associated return on CAC of 130-220%.
We will now move from analyzing unit economics to estimating the overall valuation of the company before it goes public. We don’t have a reference price for the offering yet (remember, they are doing a DPO, which means there is no IPO price), but in August 2020, the company had completed a private funding round at an implied valuation of $3 billion. One may wonder, then, whether this valuation is justified, assuming that the reference price won’t be significantly different from this. To answer this question, we took the models that we had estimated to infer Warby’s unit economics, but instead of focusing on the value of customers that are already acquired, we now focus on what these models imply for future revenues, profitability, and ultimately, cash flow, to understand what this implies for their overall valuation.
In short, our analysis shows that the baseline equity value of Warby Parker is $2.5B – 17% below valuation implied by the latest funding round. There are scenarios where valuation reaches $3B, but these scenarios require either more aggressive G&A cost optimization (both fixed and variable), or more optimistic WACC assumptions relative to companies that are comparable to Warby Parker.
While we provide some of this scenario analysis below, you may have different assumptions than we do, and may wonder what happens to Warby’s fair valuation under those alternative assumptions. Well, we have made it easy for you to be able to run those scenarios! We published an interactive Warby Parker CBCV simulator expressly for this purpose. Through the simulator, you can tweak various customer-based and financial assumptions and see how they impact company valuation and stock price in real-time. You can use it for “what if” analysis – for example, what it means for the stock price if Warby were to reduce their churn by 3%, or the other way around – what needs to be true to justify a certain price level. Play around with the simulator – it’s informative, and dare we say it, fun.
Valuation Model and Assumptions
Remember, the models that we use for this exercise are the same ones we had used to perform our unit economic analysis. As such, these models are already validated, allowing us to move beyond validation to see what they mean for overall valuation. After we generate future revenue forecasts through the probability models, we translate them into free cash flow estimates by making assumptions about future expected cost margins, working capital, capital expenditures , and the like. We then use a traditional discounted cash flow valuation model to estimate the fair valuation of the company’s equity.
Below is a quick summary of our main financial assumptions:
| Assumptions | Current Level | Target Level |
|---|---|---|
| Gross Margin | 60% of net sales | 60% of net sales |
| Marketing spend | 19% of net sales in 2020 | Reaches 12% in 5 years |
| G&A | 54% of net sales in 2020 | Reaches 25% in 10 years |
| Capex | 9% in 2019, 5% in 2020 | Stays flat at 9% for 5 years, drops to 5% after |
| WACC | 11% |
Here is why we believe these assumptions are reasonable:
- COGS/Gross Margin: COGS has consistently remained at 40% of sales over the last three years. Had there been signs of trending (upward or downward), we would certainly want to account for that in our projections, but there is little evidence of time dynamics here. As such, we assume COGS remains at this level going forward.
- Marketing spend: in 2020, Warby Parker’s marketing spend jumped to 19% of net sales from 13% in 2019, in part due to a higher share of customers acquired through the online channel during COVID (which will reverse itself), but also in part due to a concerted push by Warby to advertise more, especially through channels such as TV (which may endure for a longer period of time). We assume that as Warby continues to expand its offline retail footprint and matures, its absolute marketing spend will continue increasing, but at a slower rate than sales, falling to 12% of sales over the next 5 years. We believe this reasonably trades off the fact that CAC tends to increase over time and Warby Parker is telegraphing higher marketing for some period of time on the one hand, against the fact that COVID will reverse itself and then some, as mix shifts back to stores.
- G&A: we assume G&A expenses are partially fixed and partially variable. In 2020, G&A expenses were ~54% of net sales. Warby Parker is still a relatively young company, and as it reaches economies of scale, we assume that G&A will fall to 25% of sales, making it an effectively variable cost. It is worth noting as well that Warby’s main competitors sport G&A overheads of 30%-45% of revenues, far in excess of what we are projecting for Warby itself. Granted, these competitors have more store footprint, but let’s not forget that Warby Parker had almost two thirds of its revenue coming from stores as recently as 2019 – they are a store-based business that does some sales online, not the other way around. The logistical expenses associated with maintaining stores is likely what is driving high G&A at peer firms, and thus is likely to continue to weigh on Warby’s own margins as well, as the company has and continues to lean into stores to keep their CAC down.
- CapEx: Warby Parker’s investment in property and equipment was 5% of sales in 2020, down from 9% of sales in 2019. CapEx was lower in 2020 due to slowdown in new store openings, making 9% a more accurate estimate of Warby Parker’s capital expenditures during normal times. In addition, the S-1 mentioned that Warby Parker is aiming to grow the company through “significant expansion of retail store footprint.” Therefore, we expect that CapEx will stay constant at 9% of sales for the next 5 years, consistent with the expectation to heavily invest in stores, then the percentage will decrease to 5% over the following 5 years. We also assume that Depreciation and Amortization will converge to the same 5% over 10 years, in line with CapEx.
- Weighted average cost of capital (WACC): Comparable online retail companies (with a brick and mortar component) have WACCs ranging from 8% to 11%. Since Warby Parker’s capital structure is 100% equity, we assume that its WACC is at the upper end of this range, or 11%.
We should note that you can adjust each one of these parameters in the valuation simulator to see what it implies for Warby stock price under your own set of customer and financial assumptions.
Valuation Results
Under the assumptions we outlined above, we arrive at a fair valuation for Warby Parker of $2.5 billion or ~$22 per share (assuming 111M outstanding shares). This is 17% below the $3B valuation implied by the company’s latest funding round. We note that valuation is quite sensitive to two key assumptions: target G&A expense and WACC. The table below provides a sensitivity analysis of total valuation and price per share to these two parameters:
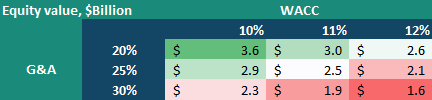

The sensitivity to WACC is a natural reflection of the fact that a lot of the value (i.e., cash flow) is expected to come in the outer years for this company. In this way, one could analogize the fair valuation of Warby Parker’s equity to a long duration bond – valuable, no doubt, but that the value is highly sensitive to expectations of interest rates. Same situation here. In the same way, this also naturally means that our model is sensitive to assumptions about what long-run margins will be. Market consensus changes in long-run margins could lead to significant stock price volatility, because again, all the value appears to be driven off of what will happen many years from now.
As you can see, in order to get close to a $3B target valuation, we need to either assume a WACC of 10%, or that the company must get to a 20% long-term G&A target, which is essentially only its variable cost and seems to be rather aggressive. Either way, the uncertainty around our estimate is quite high and $3B is at the upper end of the valuation range. This would make us a bit cautious about the risk/reward of an investment if the company were to begin trading at that sort of valuation. This could be fair, but we would need additional information to make us more comfortable that Warby Parker will be able to generate the operating leverage they would need to justify this valuation.
Note, too, that our model is actually overly optimistic about revenue over the next couple of quarters – Warby Parker provided revenue guidance a few days ago, and our revenue forecasts are 5% higher than their guidance (due to a deliberate decision on our part to exclude seasonal variables from our model, to focus more upon longer-term forecasting validity and not every little wiggle and jiggle along the way). The fact that we are optimistic, at least over the short term, makes it all the more striking that our valuation conclusions are somewhat cautious – as we revisited each and every one of our assumptions, it isn’t obvious to us that our model is pessimistic. For example, over the next 15 years, we project that the company will acquire another 40M customers. That is a good number of customers relative to the 6.6M that they have acquired thus far to date, implying very strong penetration of the target markets they are currently serving. And as mentioned earlier, our margin assumptions are generous, if anything, implying long-term margins that are significantly higher than any of their peers. But again, you might have other information that leads you to different assumptions, so sensitize away through that simulator!
September 28, 2021
Peter Fader is the author of “The Customer Centricity Playbook” and a co-founder of Theta. Daniel McCarthy is a co-founder, Hallie Gu is a Data Scientist, Nickhil Nabar is Head of Data Science and Engineering, and Val Rastorguev is a Director of Theta, a company specialized in Customer-Based Corporate Valuation — valuing firms by forecasting what their current and future customers will likely do.
This article is for informational and educational purposes only, you should not construe any such information or other material as investment, financial, or other advice. Nothing contained in this article constitutes a solicitation, recommendation, endorsement, or offer by Theta to buy or sell any securities or other financial instruments.