Wayfair 2022 CBCV: is the equity worth nothing?
Written by Ian Frankenburg, Val Rastorguev and Daniel McCarthy | November 2022

It’s been four years now since our updated analysis of Wayfair, with some extraordinary interim events, to put it mildly. The global pandemic and recent economic upheaval have disrupted many aspects of ecommerce, so we thought it was time to revisit our analysis and valuation of Wayfair.
When we posted our previous Wayfair analysis in Q3 2018, the company’s stock traded at around $135. It reached its all-time high of ~$356 on March 21, 2021, then lost more than 90% of its value to close at $28.75 on November 9, 2022.
In this analysis, we uncover whether any substantive changes have occurred in the unit economics in light of these unforeseen and historic events. We used our model forecasts to arrive at a Customer-Based Corporate Valuation® (CBCV) estimate that, interestingly, mostly aligns with our previous customer analysis, but turns out to be significantly worse for the overall equity valuation due to the retailer’s struggle with fixed costs,high cash burn rate, and as a result, a large amount of debt on its books.
Summarized Findings
The key points of our analysis are summarized below as follows:
- While the pandemic created a large surge in consumer demand, perhaps driven by stay-at-home-orders or stimulus checks, the current data suggests this effect is gone. At best, we have returned to the baseline from our previous analysis, though the current model suggests the home retailer is in an even worse position than before the pandemic.
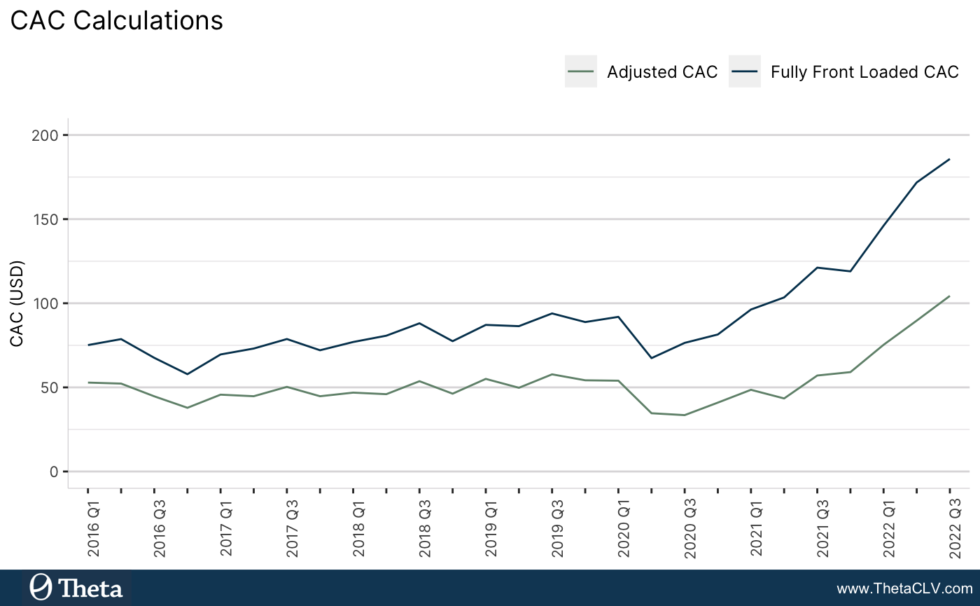
- CAC continues to increase no matter how it is calculated, more than doubling over the last two years from $76 to $186 on a fully front-loaded basis (and more than tripling from $33 to $104 under the alternative “Adjusted CAC” definition Wayfair has proposed). We illustrate with two separate calculations that show, even giving Wayfair the benefit of the doubt, there has been a surge in the cost of acquiring customers. With our updated Post-Acquisition Value (PAV) of recently acquired customers at $67, this implies strongly negative unit economics.
- Because Wayfair is saddled with a large amount of debt, we simply cannot arrive at a favorable valuation, using our model-based forecasts, even in the most optimistic scenarios. Our equity value estimate for Wayfair is negative $10 per share in the baseline scenario and $6 per share under more optimistic assumptions about the company’s ability to improve its margins.
CBCV Model Update
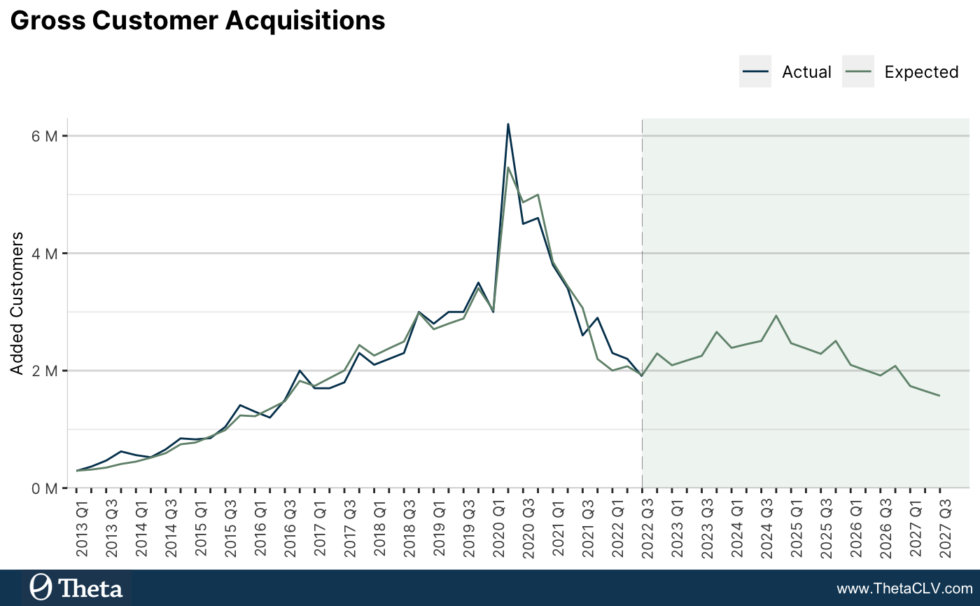
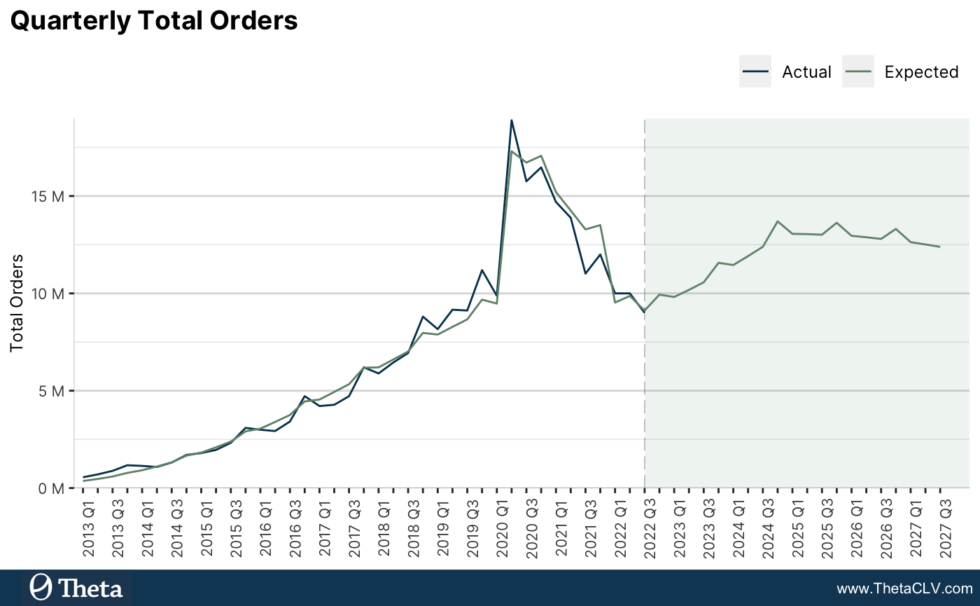
To update our Wayfair CBCV model, we added the latest data points from the retailer’s quarterly and annual reports since 2018 and re-ran the model on the most up-to-date dataset. Here is the data for four key customer metrics we use in our CBCV model – quarterly gross customer additions, total orders, annual active customers, and revenues:

We found that despite skyrocketing demand after the immediate onset of the pandemic, the data shows that these improvements were not sustained. A large swath of new customers looking to retrofit the home office during stay-at-home orders has likely left (or is leaving) the overall base of Wayfair customers. This appears in our model-implied latent churn estimates as well. The 2018 quarterly churn estimate is lower than in our updated analysis, meaning the group of new customers and subsequent bump in orders and revenue were short-lived indeed.
One may argue that the accelerated decline of key customer metrics post-Covid that we see in the disclosed data may simply be a result of Covid-driven demand pulled forward and that demand will revert back to the pre-Covid levels in 1-2 years. In our baseline scenario, we assume that pulled forward demand is now causing part of the decline in demand, but that this COVID-induced decline is temporary and will end by 2024, after which the customer metrics will return to the pre-Covid baseline trajectory.
Additionally, we interrogated our model to see what plausible range of forecast scenarios were compatible with the observed data. A parameter sensitivity analysis shows forecast intervals that all align directionally. We further expand upon our sensitivity analysis in later sections, and our model point forecasts for the next 5 years are shown below.
In many ways, our current analysis is in line with the 2018 update and original academic paper, once we adjust for pandemic and inflationary effects. The pandemic led to an impressive but transitory influx of new consumer activity.
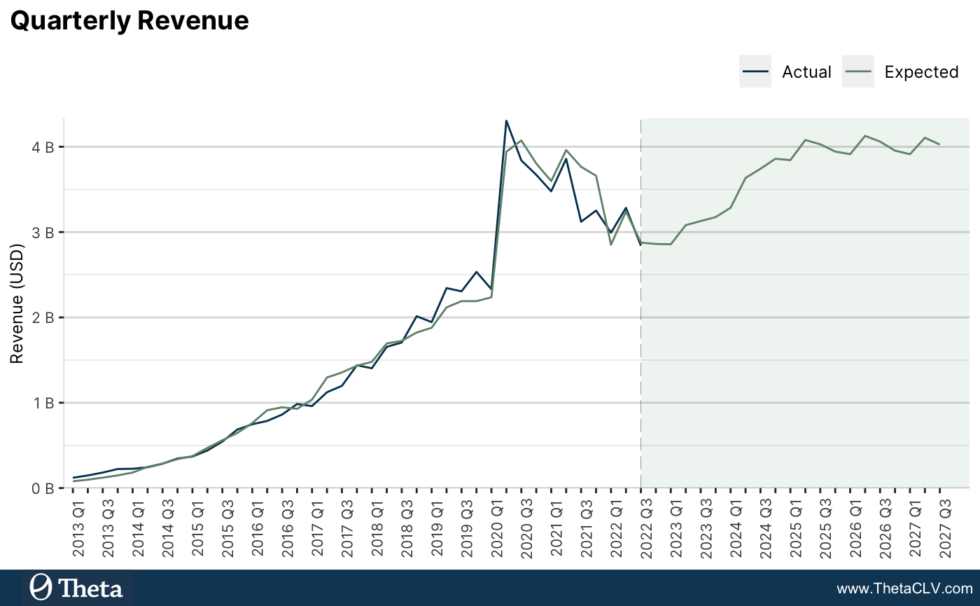
Top-line growth
Similar to other online retailers, Wayfair benefitted from a strong sales boost during the Covid-19 pandemic. Sales grew from $9.1B in 2019 to $14.1B in 2020, as more people were staying at home and avoiding stores. However, in 2021 this boost began to subside – revenue fell to $13.7B and continued to decline over the last 12 months ($12.4B as of Q3 2022). The question that we look to answer in our analysis is whether the retailer will see continued growth after the Covid bump dies down, what the future revenue trajectory will look like, and what it means for company valuation.
So far, we see strong indications that revenue is falling back to the pre-Covid baseline trajectory and, in line with our previous analysis, is expected to peak and start declining over the next couple of years. In fact, other leading customer metrics, such as new customer acquisitions, indicate that the decline will happen faster than we expected earlier.
Profitability Analysis
After turning a profit for the first time in its history in 2020 due to the Covid boost, Wayfair’s operating profit is back in the negative in 2021 and the last 12 months. The company is still quite far from its profitability targets with Selling, Operations, Technology, General & Administrative (SOTG&A) expense growth being a major challenge for the company.
In addition to that, by Q3 2022 Wayfair accumulated a whopping $3.1B in debt (versus less than $500M in Q2 2018 when we ran our previous analysis). Accounting for excess cash, net debt is approximately $3.0B. This means that whatever fair enterprise valuation (EV) we end up estimating, more of that EV will have to go to the debt holders before the equity holders are entitled to their share. This increase in debt is due to the large free cash flow losses that the company has been incurring since our last analysis – shortfalls that they have been borrowing their way out of.
Let’s look into these factors in more detail.
SOTG&A
Wayfair has been struggling to reach its target Selling, Operations, Technology, General & Administrative expense level. Excluding equity-based compensation, SOTG&A as a % of revenue was 13.2% in 2018, fell to 11% in 2020 due to the Covid revenue bump and corresponding economies of scale, but then jumped back to 17.2% in the last 12 months.
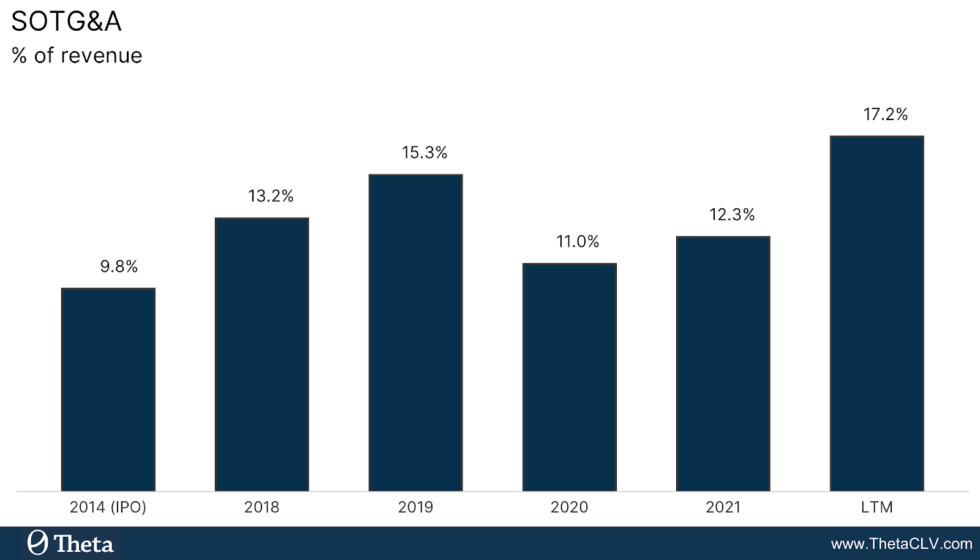
This is way above the 5-7% target that Wayfair discloses in their investor presentations.
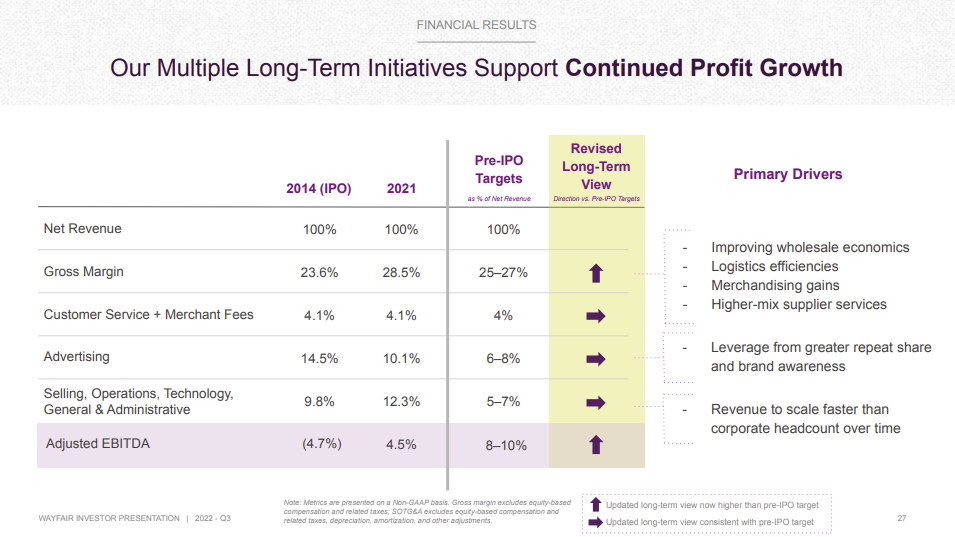
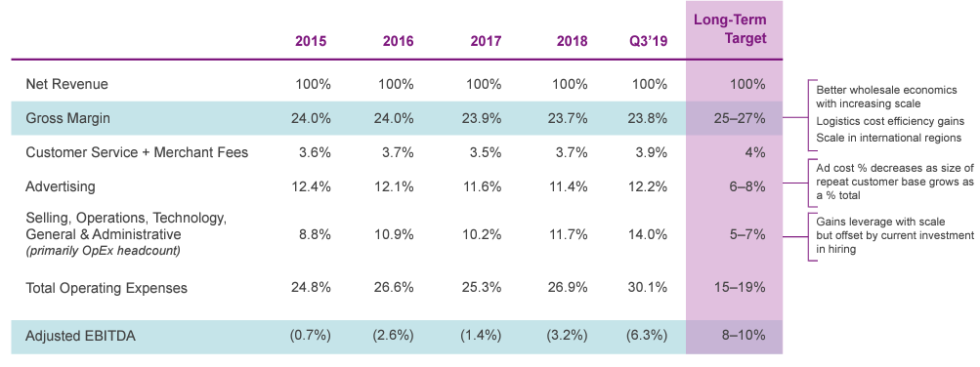
Notice, too, how Wayfair framed their long-term targets in the table above. For years, Wayfair had presented a summary of historical costs each year, followed by the most recent quarter, then the long-term targets. Wayfair’s Q3 2019 investor presentation is one such example:
Because the intermediate figures don’t paint Wayfair in a favorable light, it is striking that for its Q3 2022 results, Wayfair would not show any 2022 results at all, and instead focus on 2014 (the year before the IPO), and 2021, followed by the long-term targets. Unfortunately, these framing effects do not change the underlying achievability of these margin goals.
Looking ahead, we are skeptical that Wayfair will be able to reach the 5-7% SOTG&A margin target. On the one hand, the company is working to slow down its SOTG&A growth – it implemented a hiring freeze and laid off 5% of its global workforce, which will help it better manage overhead to some extent. But on the other hand, with expected future revenues declining, the company can’t count on the economies of scale anymore. If anything, the SOTG&A margin might go up more unless Wayfair takes a more aggressive approach to managing its fixed costs. Even in their best year, 2020, when COVID caused Wayfair to have a virtual monopoly over the e-commerce furniture category, it reached 11% – almost double the target mid-point.
In our valuation model, we give Wayfair all the benefit of the doubt and assume that it will be able to get back from the current SOTG&A margin level back to the 2021 level (12.3%) in the next 5 years and keep it flat afterwards. We believe this is still a somewhat optimistic assumption because:
- 2021 has some residual effect of the Covid revenue bump, which has pretty much faded out.
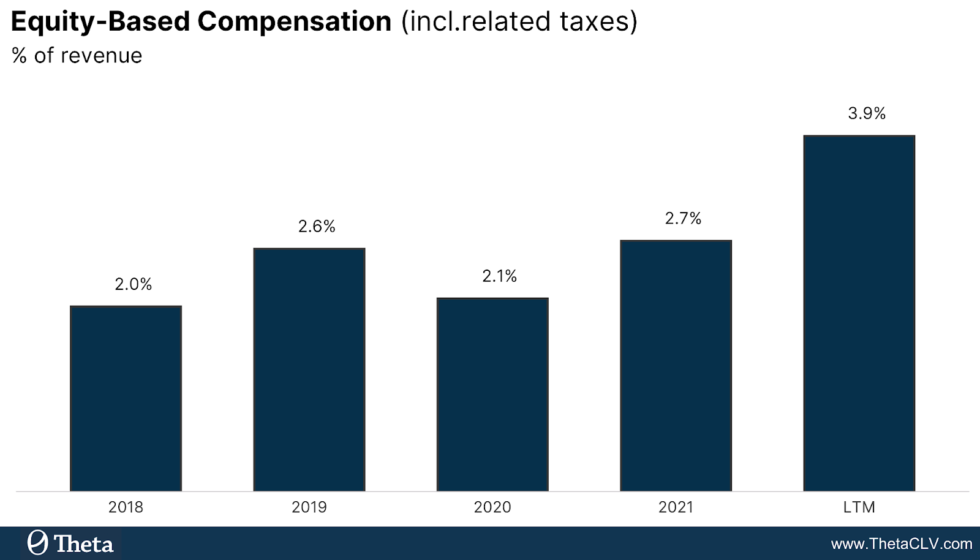
- The 12.3% target number does not include equity-based compensation. In fact, when Wayfair excludes equity-based compensation from SOTG&A (and EBITDA, thus focusing on more favorable “Adjusted EBITDA”), it increases company margins by around 3-4 percentage points compared to GAAP profitability metrics. This issue has become more significant over the last few years and even accelerated in the last 12 months. In reality though, we believe equity-based compensation should be accounted for in the SOTG&A for valuation purposes, even though technically it’s a non-cash expense.
Advertising
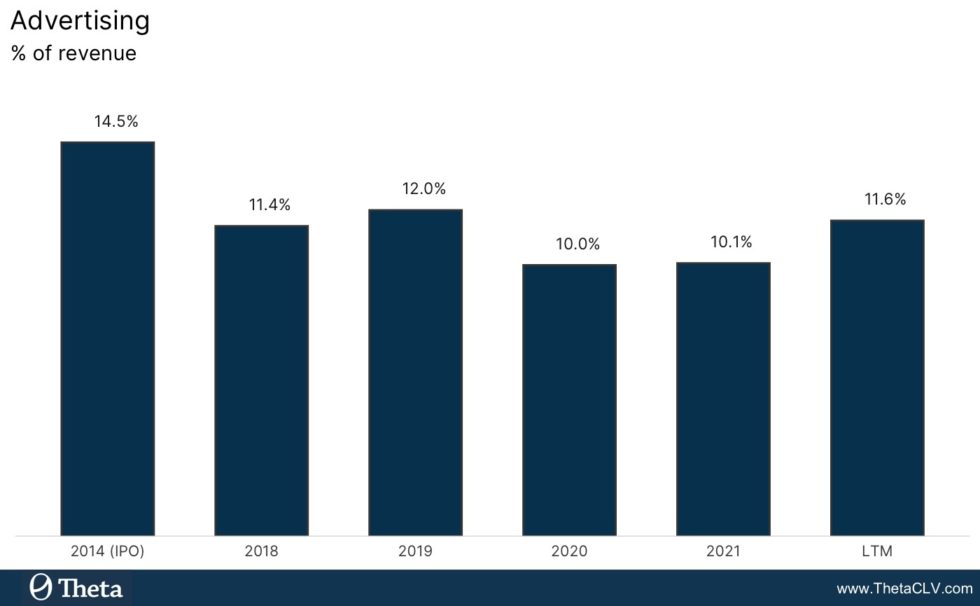
Advertising spend as a percentage of revenue remained between 10-12% since 2018, with a largely flat trend. This is below the 2014 pre-IPO level of 14.5%, but still higher than the long-term target of 6-8%.
Despite the relatively flat trend of advertising spend, in the last 4-5 quarters, Wayfair’s customer acquisition cost (CAC) skyrocketed due to declining new customer acquisitions, making its growth substantially more expensive. Using a fully front-loaded CAC metric (total advertising spend divided by the number of new customer additions in the same period) consistent with our previous analyses, the cost of acquisition increased from $80 in 2018 to $150 in the last 12 months, reaching a whopping $186 in Q3 2022.
One may argue that this number is elevated and some of the advertising spend should be earmarked towards repeat orders from existing customers. Even if we take this approach and assume that customer retention requires advertising spend at 7% of repeat revenue, adjusted CAC would still have grown substantially, from $48 in 2018 to $104 in Q3 2022 (and importantly, the contribution margin is 7 percentage points lower than if we were to assume that CAC is fully front-loaded!).
In our valuation model we assume that Wayfair will reach its long-term advertising spend target of 7% in the next 5 years.
Gross Margin
Wayfair gross margin jumped up from 23.5% to 29.1% in 2020 due to the economies of scale resulting from the Covid bump in the number of delivered orders. However, since 2020, gross margin has been slowly declining, but improved to 29% in Q3 2022.
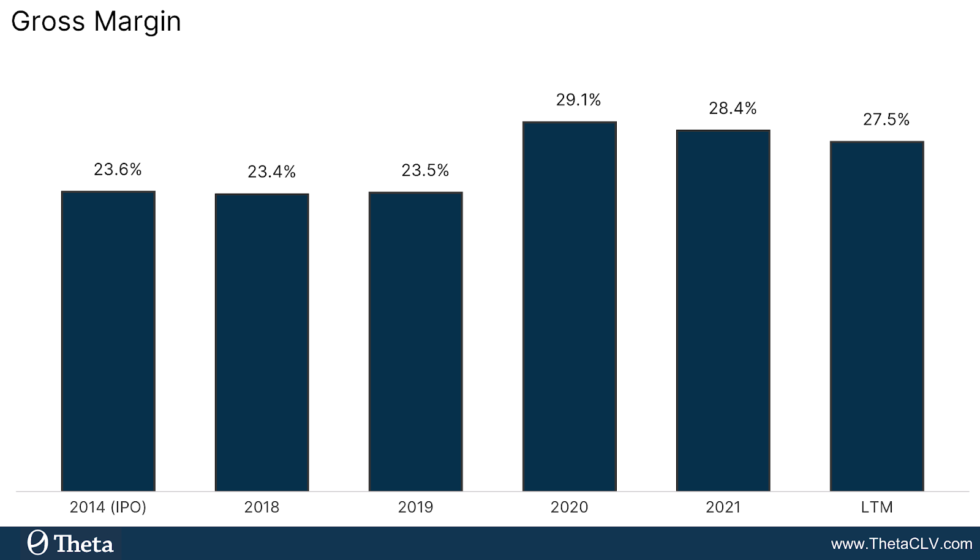
Because of that, in Q3 2022 Wayfair moved its gross margin guidance up to 28-29% for Q4, noting on the earnings call that “many of the drivers of gross margin outperformance in Q3 are expected to continue. But the typical holiday mix shift will weigh a bit on gross margins in Q4, so we expect to see some pressure sequentially”.
In the valuation model, we assume that gross margin will stay at 28.5%, the midpoint of the range.
EBIT
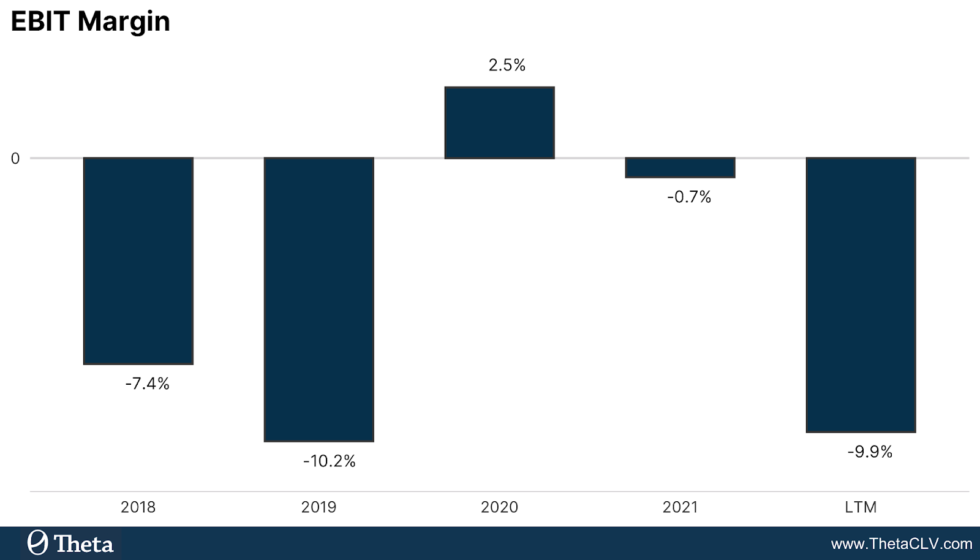
Wayfair had been extending its operating losses until 2020, when the pandemic hit and boosted its sales. In its best year, the retailer demonstrated a modest 3% operating margin, but since then its profitability started to decline back to the pre-Covid levels, reaching -9.9% in the last 12 months, driven by elevated SOTG&A and Advertising expenses, partially offset by stronger gross margin.
Unit Economics
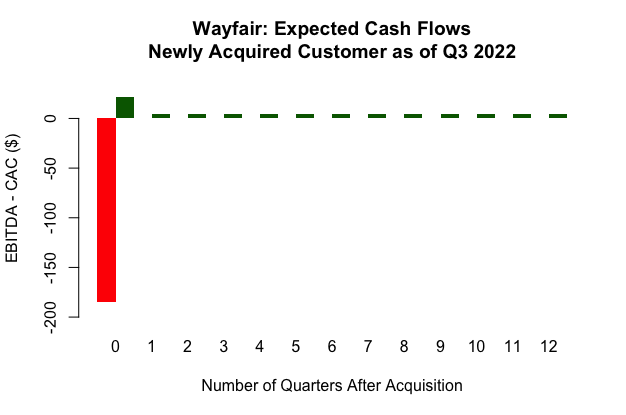
We evaluate Wayfair’s unit economics using our CBCV model by predicting future churn, repeat purchasing, spend per order, and applying future expected profitability margin for recently acquired customers, exactly the same way it was done in the original Wayfair paper.
Our analysis shows that the Post-Acquisition Value (PAV) of the Q3 2022 cohort is $67 – slightly above that in our previous analysis due to higher average order value. However, due skyrocketing CAC for the same cohort ($186 on a fully front-loaded basis), we conclude that Wayfair actually expanded its loss per acquired customer to $119.
If, instead of Fully Front-Loaded CAC, we use Adjusted CAC we discussed above, then we should also adjust customer PAV for the amount of revenue Wayfair spends to maintain repeat orders. Using a consistent definition (“customer retention requires advertising spend at 7% of repeat revenue”), we estimate Adjusted PAV of customers acquired in Q3 2022 at $55, which, compared to Adjusted CAC of $104 in the same period, still implies strongly negative unit economics.
Valuation
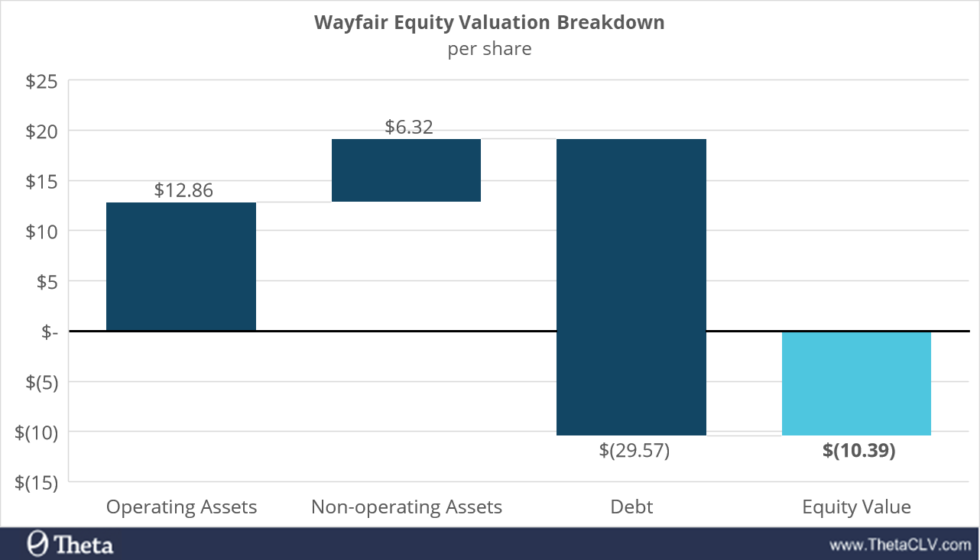
In line with the Customer-Based Corporate Valuation® (CBCV) methodology, we estimate the equity value of Wayfair by forecasting the company’s future customer-based revenues (which are a combination of customer acquisition, retention, repeat purchasing, and spend models), translating them into free cash flows, and finally using the DCF approach to arrive at the company’s enterprise value. We then add the value of non-operating assets (excess cash and short-term investments), and subtract net debt to get the equity value of the company.
Baseline result: Our updated model shows that the equity value of Wayfair is actually negative: -$10 per share. This is way below our last estimate of $10 per share and is a result of the retailer’s (1) continued growth of SOTG&A expenses with little confidence in its ability to bring them down to the target level, and (2) large net debt resulting from the company’s cash burn rate.
Upside scenario: We ran an alternative scenario in which we gave Wayfair the benefit of the doubt on its cost structure, to see what impact this would have on our fair valuation estimate. To be specific, we assume that the company is successful in reducing its SOTG&A expense to 9.8% of revenue over the next 5 years (the same number we used in our previous analysis). Note that this number includes equity-based compensation, so is effectively equivalent to 6-8% using Wayfair’s definition of SOTG&A, which is very close to its aforementioned declared long-term target. In this very optimistic scenario (remember: SOGT&A was 15% of revenue before the pandemic, fell to 11% during the pandemic, and now sits at 17.2%), our equity valuation is just shy of $6 per share – an improvement, no doubt, but still below our 2018 valuation and the current market price of about $29.
Conclusion
No matter how we look at the data or what assumptions we make about Wayfair’s future margins, our CBCV models imply that Wayfair’s equity is not worth much. As in our original analysis, this largely stems from the company’s weak unit economics, and is further compounded by a struggle to keep fixed costs down and high cash burn rate. Even the Covid-19 pandemic, which simultaneously gave Wayfair a virtual monopoly over the e-commerce furniture category and a surge in work-from-home office-driven demand, didn’t bring it close to key margin targets. If it couldn’t do so then, we are concerned whether it will ever be possible. In sum, we continue to be skeptical of Wayfair prospects, but will continue following it closely to assess whether our thesis holds.
This article is for informational and educational purposes only. You should not construe any such information or other material as investment, financial, or other advice. Nothing contained in this article constitutes a solicitation, recommendation, endorsement, or offer by Theta to buy or sell any securities or other financial instruments.