One-Year Retrospective on Wayfair: A Tale of Two Worlds, but More of the Same
It has been almost a year since we posted our original analysis of Wayfair as part of our customer-based valuation framework for non-subscription firms. There was a lot of hulabaloo after we posted the original analysis, including a sharp drop in W’s stock price and widespread media coverage from a variety of Wall Street experts and celebrities (such as Jim Cramer). After all that hoopla, though, the stock began a long period of zig-zagging – it would rise for a while, then plummet when Wayfair would release quarterly earnings. Jim Cramer’s view of Wayfair as a “battleground stock” was clearly proving to be true.
Their latest results for calendar Q2 2018, however, came with a rise in the stock price, not a drop, and the stock has been on quite a tear since. When we posted our original analysis, their stock was trading at 81.75. Here we are, almost a year later, and the stock has risen to $128.53 while short interest has fallen to 17% of float (versus over 40% at the time of the analysis).
This begs the question: purely focusing on the underlying fundamentals of the business (as seen through the customer-level disclosures that Wayfair continues to include in its 10-Q reports), what has happened since then? How do the most results for Q2 2018 (a supposedly very good quarter for the company), change our model-based assessment of where the company is headed? Our goal with the paper, at the end of the day, was to predict what Wayfair’s future stream of free cash flows would be, in order to arrive at an accurate DCF-based valuation. Let’s see how we did and incorporate that into an updated view of what this implies for the future.
The bottom line is this:
- While Q2 2018’s growth-related metrics are all within the predictive distributions we had provided in our original analysis, they are clearly outperforming our expectations. Revenues and customer acquisitions in Q2 2018 are 22% and 14% higher than we thought they would be…
- … but this extra growth came at a steep price – their advertising spend was 33% above our estimates and all margin and profit-based metrics have fallen far short of our expectations.
- Re-running the customer-based corporate valuation model on all the data up to and including Q2 2018, we forecast stronger future revenue growth…
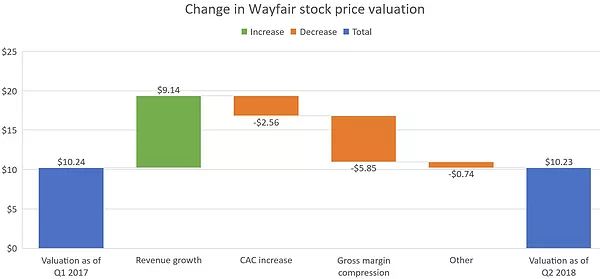
- … but not enough to move our resulting DCF-based valuation up from its current level because of the deterioration in Wayfair’s unit economics (namely, higher CAC and thinner margins). When all is said and done, our estimate of the DCF-based fair valuation estimate for the firm remains basically unchanged, at 10.23, even after we accounted for a few factors improving company’s valuation (e.g., tax cuts and a lower cost of capital).
- We estimate that the unit economics of newly acquired customers have actually gotten worse – from a $10 average loss per customer we estimated back in 2017, to $19 per customer in Q2 2018.
In this sense, it’s a “tale of two worlds”: the revenue growth story is strong, while the margin story is weak. Despite these over- and under-performances relative to our original model, Wayfair winds up exactly back where our original analysis brought us. We reiterate a question Dan McCarthy had posted in a recent interview with the Boston Globe: how is their growth transferring into profitability?
Let’s dive into both aspects of the story in more detail before wrapping up with how all of this (and more) translates into our revised valuation.
Growth: stronger than expected
In our original CBCV analysis, we had predicted that Wayfair would continue to see very strong revenue growth. We expected Q2 2018 net revenues, for example, of $1.36B. Revenues have certainly been growing strongly. In fact, they have been growing stronger than we expected – actual Q2 2018 direct revenues were $1.66B. This impressive number is in the far right tail of our predictive distribution for revenues (the 99th percentile, to be exact).
The same holds true for new customer acquisitions. We had expected that in Q2 2018 they would acquire 1.94MM new customers when in fact they had acquired 2.22MM. We undershot new adds by 14%.
No doubt about it, growth has been strong – stronger than we had predicted.
Moving from growth to unit economics
Typically, beats and misses of this magnitude all go in the same direction – if you beat on revenues by a wide margin, people are buying more of your stuff, so it’s more likely than not that you beat on profit-related measures as well.
What is interesting about the situation at Wayfair is that the complete opposite is true: every single profit-related measure has come in worse than we had anticipated, both in terms of absolute dollar amount and as a percentage of sales.
Ad Spend
First, there is the question of how much Wayfair is spending to generate those revenues – their ad spend.
We had projected that they would be spending $133M on advertising here in Q2 2018. Instead, they spent $178MM. So while Wayfair generated revenues and new customer acquisitions 22% and 14% above expectations, respectively, they paid for this extra growth disproportionately more – ad spend was 33% above our expectations.
Putting it differently, if we knew that they would spend this much on advertising, then at the level of advertising efficiency we had projected in our paper, we would have predicted even stronger growth metrics than we’ve actually seen. For example, given that high level of ad spending, we would have predicted new customer acquisitions of around 2.6MM, far larger than the 2.2MM that we actually observed.
What happened? No matter how we cut it, the productivity of their ad spending has been deteriorating. Ad spend per new customer acquired currently stands at a record $80, far higher than the $68.5 we had predicted in the paper.
Even if you view advertising expense as purely variable in nature, we’re just seeing a lot less leverage than we ourselves had predicted. We were expecting ad expense to have fallen to 9.9% of direct revenues by now. Instead, ad expense remains stubbornly high, at 10.7% of revenues.
For these reasons, we have updated our projected future ad spend per gross add to $77, which is equal to Wayfair’s trailing 12-month average advertising spend per gross add. Given recent trends, this will likely prove optimistic as well.
Gross margin
We had taken a relatively sanguine view of Wayfair’s gross margin, projecting that it would improve to approximately 25% in Q2 2018, on its way up to 26%. Given all the talk about the efficiencies they would be gleaning from the substantial capital investments they made in their CastleGate initiative, this felt like a reasonable expectation.
Unfortunately, that has not materialized. Instead of seeing gross margin improvement since Q1 2017, we have seen gross margin deterioration. Their Q2 2018 gross margin was 23.5%, down from the 24.7% gross margin they had achieved back in Q1 2017 when we first studied them. Their gross margin has been relatively flat over the last couple of quarters. Again, this supports the view that the company is inefficiently buying revenue growth, implicitly and explicitly.
Given that their gross margin is coming in 1.5 percentage points below our previous forecasts, we believe it is rational to revise downwards our long-term gross margin assumption for the company to 25%, which is within but at the lower end of Wayfair’s own long-term target gross margin is 25-27%.
EBIT
It wasn’t just the gross margin and advertising expense that have been far weaker than we predicted them to be – it was all their operating expense line items. Rolling it all up into their EBIT margin, our original model predicted that Wayfair’s EBIT margin would be -2.2% in Q2 2018, while their actual EBIT margin in Q2 2018 was -5.8%.
Let’s also revisit the long-term target margins model that Wayfair includes in its investment presentations, comparing Wayfair as it was in 2015 to where it is on pace to be here in 2018.
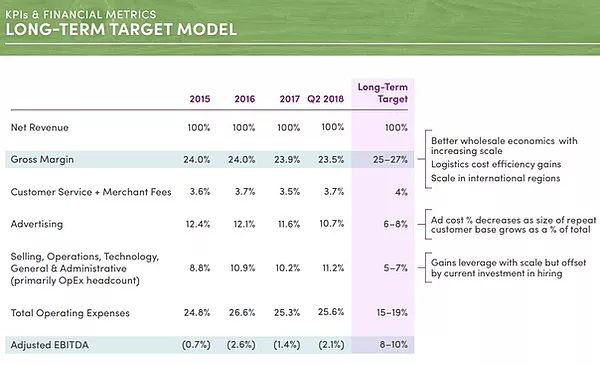
In 2015, Wayfair generated $2.2B in revenues, making it one of the biggest home goods sellers in the world at the time. Wayfair is on track to triple that here in 2018. This represents a massive increase in the scale of the business, both relatively and absolutely.
At the same time, despite the fact that revenue has tripled off a high base,
- their gross margin has fallen by 0.5% of sales
- their customer service expenses have risen by 0.1% of sales
- their SG&A has risen by 2.4% of sales
- their overall adjusted EBITDA margin has fallen by 1.4% of sales to -2.1%
Should we have not seen at least a little bit of operating leverage after revenue tripled? The only line item that is showing any signs of operating leverage is advertising expense, but as mentioned earlier, we ourselves had expected to see even more operating leverage than we have actually seen.
Re-running the valuation model
Taking in all of the new data on quarterly acquisitions, orders, active customers, and revenues, we re-ran our customer-based corporate valuation model. The results were as described above – higher revenues, fully offset by higher ad expense per acquisition ($80 per add in Q2 2018, up from $68) and lower gross margin (trending to 25%, down from 26%). Net-net, our valuation estimate as of Q2 2018 was, for all intents and purposes, the same as it had been in Q1 2017 (for all other valuation adjustments, see the appendix):
Our analysis generated many headlines when it was first published, stemming from our conclusion that Wayfair incurs a loss of about $10 for each new customer it acquires. Well, because of the higher CAC and worse margins, the new figures would suggest a loss closer to $20. This is a graph of the expected cash flows associated with a newly acquired customer, updated to include the new model estimates:
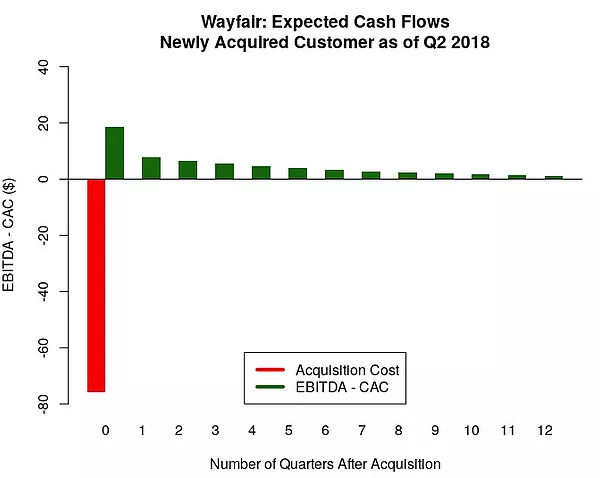
We have spoken with a hundred investment funds at this point about Wayfair, some long and others short. Those we have spoken to who are long Wayfair have argued that this chart is overly pessimistic for the following reasons:
- Some of this advertising expense is actually being spent on existing customers – basically, take some of that red bar and allocate it to future periods. Whether this helps or hurts the average profitability of a customer depends on how strongly you assume ad expense loads onto repeat orders, but the effect is not large, and holding all else equal, stems from time value of money effects. Ad expense not earmarked towards customer acquisitions does not simply go away, and may load more heavily onto repeat orders than one may think because the number of repeat orders is relatively small.
- The profit margin that should be applied to the stream of revenues from a new customer should be the contribution margin. We do not agree, because the contribution is not the fully loaded variable profit margin associated with a marginal dollar of revenues, which is ultimately what we are looking to estimate in the figure above. In fact, even Wayfair doesn’t agree, implicitly. The long-term target margins that we discussed previously would suggest that in steady state, every dollar of revenue will carry with it 73-75 cents of cost of goods, 4 cents of customer service and merchant fees, and another 5-7 cents of SG&A, holding aside stock-based compensation. While opex is not COGS, it is nevertheless very frequently the case that many opex line items are a lot more effectively variable than many would like to believe.
In sum, when we look at where Wayfair’s underlying financials are now relative to where we thought we would be, the situation at Wayfair has actually been worse than we had predicted. To the extent that the company remains a standalone going concern, and cash flows drive its valuation, our thesis here remains exactly the same as it did when we first wrote up our analysis.
Appendix
Below are the main other adjustments made to get to our overall valuation estimate, comprising the “Other” category in the valuation waterfall chart above:
- (-) Capex: we assume that capex will remain at its current level of 3% of sales for the next two years and then linearly decline to the long-term target of 1.8% of sales (level of D&A). If anything, this might be an optimistic assumption. Michael Fleisher, CFO of Wayfair, indicated that they are not expecting capex to go down in the near term. We had originally assumed a lower level of capex in coming quarters.
- (-) Non-financial working capital: a combination of increasing working capital requirements (from -6.7% a year ago to -6.0% in Q2 2018) and growing revenue results in more cash required to finance operations and therefore lower free cash flows.
- (+) Tax rate reduction: the Tax Cuts and Jobs Act signed into law in 2017 permanently reduced the top corporate tax rate in the US from 35% to 21%, improving Wayfair’s valuation accordingly. KPMG estimates that the net effective tax rate, accounting for state and local taxes and corresponding federal tax deductions, is approximately 27%.
- (+) WACC: Wayfair’s WACC has declined from 12.9% in Q1 2017 to 11.5% in Q2 2018, as per Bloomberg. This results in more favorable company valuation.
Aug 27, 2018
Daniel McCarthy and Peter Fader are co-founders and Val Rastorguev is a Director at Theta Equity Partners, a company specialized in Customer-Based Corporate Valuation services — valuing firms by forecasting what their current and future customers will likely do.