Lyft IPO: Cautiously Optimistic Unit Economics Despite Significant Losses
Second part of our analysis that converts unit economics insights into an overall fair valuation estimate is published here.
On March 1, Lyft filed a Form S-1 with the SEC as part of its plan to raise $100 million at a valuation of $20 to $30 billion through its long-awaited IPO. The company disclosed a sizable operating loss of $978 million on $2.2 billion revenue in 2018, implying a -45% operating margin. A big question, of course, is whether there is a path to profitability if Lyft were to continue growing.
The key to answering this question lies in Lyft’s unit economics – if Lyft can earn a healthy profit on the customers that it is acquiring, then the company can justify early losses stemming from up-front investments needed to bring customers in the door in the first place. The key, then, is to understand how much the firm is spending to acquire customers, how large the future revenue stream is from those customers after they have been acquired until they churn, and how much of those revenues can be expected to flow through into variable profits.
This is what we will analyze in detail in this post, featuring the perspectives and methodology arising from Customer-Based Corporate Valuation (CBCV), which is the hallmark of our firm and the recent publications that underlie it.
Here is a summary of our findings:
- Loyalty varies widely across Lyft customers. We estimate that even though 78% of acquired customers churn within a year of acquisition, there is a significant segment of highly loyal customers who will stay with the company for many years to come (for example, 10% of newly acquired customers are expected to be with Lyft even after 10 years).
- We estimate that Lyft spent ~$32 to acquire each new customer in 2018. CAC was stable at $31 to $32 per acquired rider in 2017-2018 after declining from $47 in 2016, possibly as a consequence of Uber’s problems in 2017. This is heartening.
- On average, newly acquired customers generate $19 in CLV, netting $51 in post-acquisition value per customer against $32 spent on CAC. We estimate that the average payback period for a newly acquired customer is 14 months.
- Variability in customers’ CLVs is high. The company may be losing money on up to 80% of its customers, but more than makes up for it on the highly loyal other 20%.
- Because Lyft’s positive unit economics so far is largely coming from a relatively small proportion of highly loyal customers, its path to profitability hinges on its ability to continue acquiring these “power users” in coming years.
Overall, and in contrast to much of the commentary we have read about Lyft’s financials to date, these results paint a relatively constructive view of Lyft’s unit economics to date. Note that we do not delve into the attractiveness of Lyft’s overall valuation in this post, as that would require us to incorporate projections of future customer acquisitions and balance the variable profitability profile implied by this analysis with the firm’s fixed costs. But at the very least, these results would suggest that there could be a very clear path to profitability because the firm appears to be “right side up” with their customers.
Next, we will summarize the available data, specify and validate our model for the firm. We will then discuss in detail the conclusions summarized here.
The Data
We often talk about the importance of disclosing key customer metrics to investors so that they are armed with the data they need to make informed investment decisions. Along those lines, we were delighted when we saw that Lyft disclosed what we call the customer cohort chart (or “C3”), which conveys total rides by each cohort of newly acquired customers over time:

The C3 is one of the most valuable and revealing customer disclosures we have ever come across in public filings. It provides many insights into customer behavior and greatly facilitates our ability to identify suitably rich CBCV models. We praised Farfetch for disclosing a similar chart and have identified many other companies that disclose it as well (in fact, the C3 is so important that we’re writing an entire article about it – stay tuned for more updates).
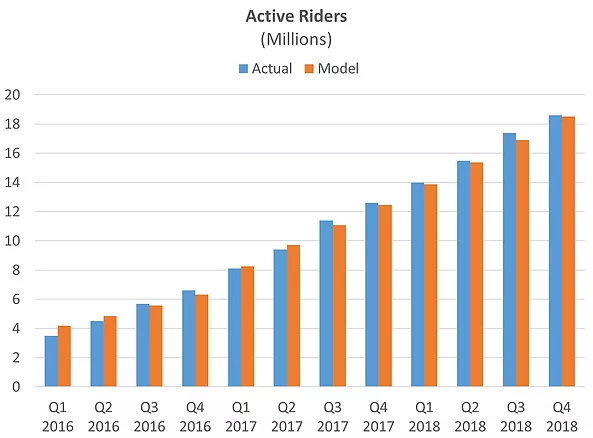
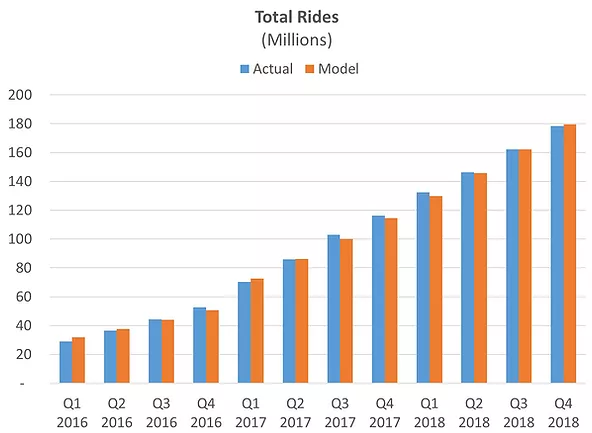
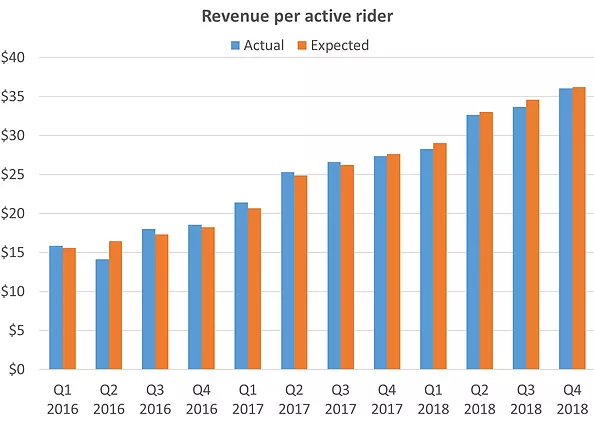
In addition to the C3, Lyft disclosed a number of other customer metrics, including quarterly active riders, quarterly total rides, and revenue per active rider:


These charts suggest positive top-line dynamics, but as always, the real question is what all of this implies for the classic CBCV components: (1) how many customers is Lyft acquiring (and at what cost), (2) how long are customers staying active after they have been acquired, (3) how many rides they make while they are active, (4) how much they spend on those rides, and (5) how much of that spend trickles down into variable profitability. The model we lay out below will provide insights into all of these dimensions.
The Model
The modeling framework we use is largely similar to the one we used to analyze Farfetch, building on the more formal methodology laid out in our paper in the Journal of Marketing Research valuing non-subscription businesses (SSRN).
Before we go further, though, we must formalize what we mean when we say “customer.” Lyft is a two-sided market, matching riders with drivers. While both sides of the market come together to create value for the company, we focus our attention on the rider side of the market and will use the terms “rider” and “customer” interchangeably. Riders directly generate Lyft’s revenues, virtually all of Lyft’s disclosures in their S-1 have to do with their riders as we can see above, and focusing on this one side of the market greatly clarifies the resulting modeling that we must do. In doing so, we implicitly assume that the balance of supply (drivers) and demand (riders) in the future will be consistent with what we have seen so far to date. We haven’t seen any information that strongly suggests otherwise.
Even though Lyft didn’t disclose its gross customer acquisition data (which the original model uses to model the inflow of customers), we generalized the model estimation procedure so that we could calibrate the model upon all of the aforementioned customer-related data in addition to the traditional financial data. As you can see below, the resulting model estimates align nicely with all of the observed disclosures.
Active riders, Total rides, Revenue per active rider:
The C3 (actual on the left, expected on the right):

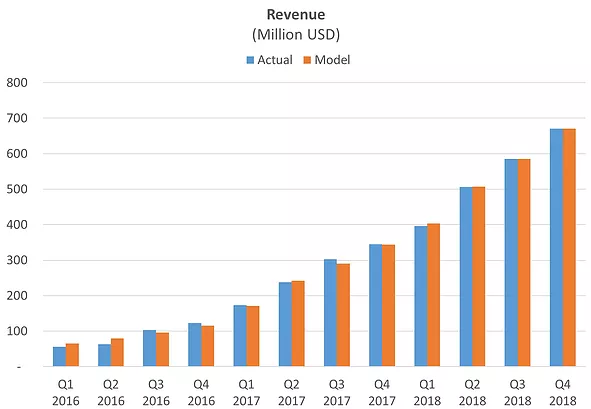
Bringing all of the various processes – acquisition, retention, rides, and spend – together into revenue estimates, we see very strong correspondence between the actual data and our model-based expectations of it:
In addition to the above data that we used to train our model, there was one “holdout” data point that Lyft had disclosed which we did not use for modeling – so we can use it as another form of model validation: the company said that it reached one million total rides some time in 2013. According to our model, they hit one million rides in May 2013. While one year is a fairly wide range, it suggests that our model is capturing different aspects of Lyft customers’ behavior quite well – giving us confidence to project beyond the available data to make the forecasts necessary for a proper assessment of the firm’s future profitability.
Results: customer acquisition cost
Estimating Lyft’s true CAC is not a trivial exercise. There are two main complications:
1) Acquisition costs are spread across Sales & Marketing expense and revenue reductions. Due to Lyft’s definition of “customers” (curiously, drivers are called customers, but riders are not), driver and rider incentives are accounted for differently. According to the S-1, driver incentives (typically, cash incentives) are accounted for as revenue reductions, whereas rider incentives (free or discounted rides) are recognized as Sales & Marketing expense. While a portion of both are presumably earmarked towards acquiring new customers, this complicates our accounting for it.
2) No data on how Sales & Marketing expense and revenue reductions are allocated between new and existing customers. As noted above, both revenue reductions and marketing expense are earmarked at least in part towards new customers. Unfortunately, Lyft does not disclose the exact split of either line item towards new customers versus existing ones.
For simplicity, we assume that Sales and Marketing expense is allocated towards CAC while revenue reductions are not. This may over-estimate or under-estimate the company’s actual CAC, depending on how much of both incentives are used for new customers, but we believe that this is a fair assumption in the absence of additional information. Moreover, it is unlikely to substantially bias our resulting CLV estimates because baking more of the revenue reduction into CAC may increase CAC but will also increase revenues, with the net effect being not so large. This also maintains consistency with our other analyses which all followed the same approach.
Even though Lyft didn’t disclose its gross customer acquisitions, our model was able to infer them using the C3 chart and other customer metrics. For example, in 2018, our model suggests that Lyft acquired 25 million new customers.
Dividing Lyft’s $803.8 million Sales & Marketing expense in 2018 by the 25 million customers we estimate that they acquired that year implies CAC of $32 (if we had assumed instead that 40%, 70%, or 100% of all revenue reduction and Sales & Marketing expenses were earmarked towards new customer acquisition, CAC would be $21, $38, or $54). We can see CAC dynamics over the last three years on the chart below:
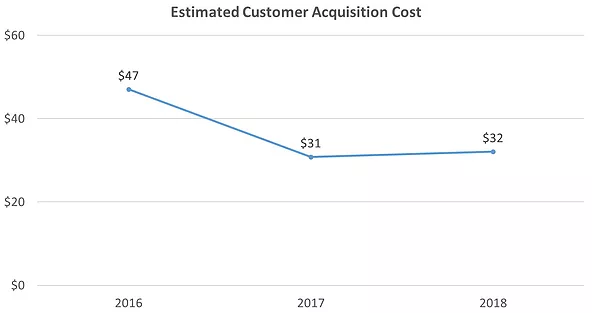
Our model infers that CAC significantly dropped in 2017. This was largely driven by sharply higher customer acquisitions, while growth in Sales & Marketing expense was not nearly as large. This may have been a byproduct of a series of scandals Uber faced in 2017, which significantly helped boost Lyft’s customer base (more on this below). After that, CAC seems to have stabilized.
Overall, this is a heartening sign that the cost to acquire new customers is not that high in an absolute sense and has remained relatively steady in the last two years.
Results: Post-acquisition value (PAV)
Next, we turn to how much customers are worth after they have been acquired, breaking that “post-acquisition value” (PAV) into customer retention, riders per active customer, revenue per ride, and the variable margin on those revenues.
Customer retention
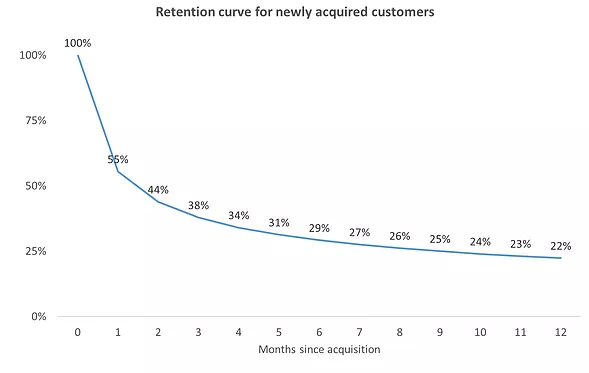
Based on our analysis, we infer that loyalty varies widely across Lyft customers. This is an important point, suggesting that a simplified analysis of an “average” customer (as is done by virtually all analysts) can be grossly misleading. Our model suggests that even though about half of newly acquired customers drop out after only one month and 78% churn within a year of acquisition, there is a significant segment of highly loyal customers who will stay with the company for many years to come. For example, we estimate that about 10% of newly acquired customers will still be with Lyft even after 10 years. This heavy tail of highly loyal customers is a valuable asset and ignoring it by looking at an average churn rate can significantly undervalue a company (for more on this, see here).
This is Lyft’s implied retention curve for newly acquired customers:
Repeat rides
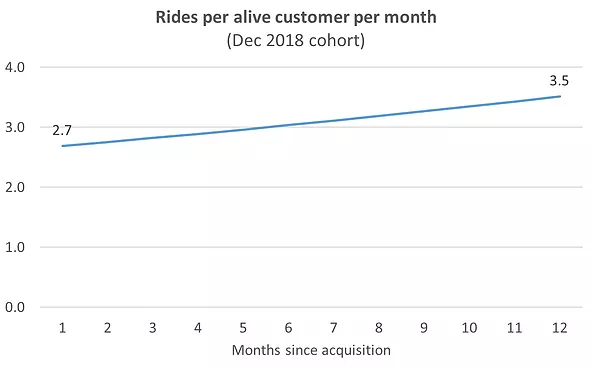
Not only do loyal customers stay active longer (and therefore generate profits for Lyft over longer periods of time), they also ride more. Our model suggests that, for example, if an average customer acquired in December 2018 stays alive, their Lyft usage is expected to grow from 2.7 rides per month after they are acquired to 3.5 rides per month after one year. This usage growth is also evident in the C3 chart. To avoid extrapolating this growth into infinity, we assume the usage growth flattens out after three years since customer acquisition.
Revenue per ride
According to the S-1 filing, Lyft has been able to consistently improve revenue per active rider due to “greater ride frequency, increased service fees and commissions, improved efficiency and effectiveness of driver incentives and reduced market-wide price adjustment promotions offered to ridesharing riders” (page 80). Our model also infers an increase in revenue per ride since 2016. Since the company itself did not have much confidence that this growth will continue in the future (“However, the amount of the historical increases in Revenue per Active Rider may not be indicative of future growth, and the growth rate and amount of Revenue per Active Rider may fluctuate or decline in future periods,” page 80), we assume that the revenue per ride will stabilize and remain flat at around $3.80 per ride in 2019 and onwards.
Cash flows and customer value
Next, we combined all of these behavioral models together to predict the future variable profits of customers and ultimately, customers’ overall post-acquisition value (i.e., the net present value of all future variable profits after acquisition). The chart below shows our projections for monthly expected revenue per acquired customer for customers acquired in December 2018 over the ensuing five years:
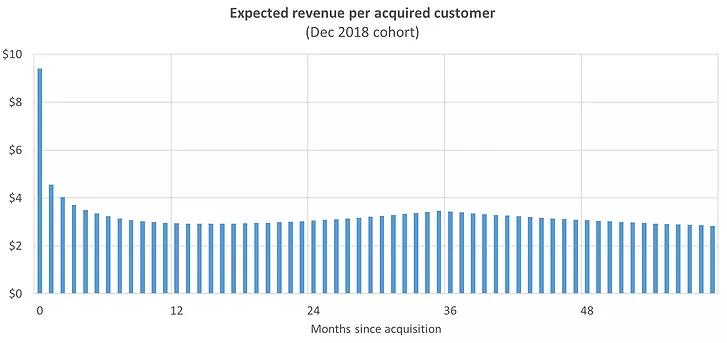
After the initial cohort shakeout in the first year since acquisition (when customer churn outpaces increase in service usage), revenue slightly rebounds due to the continued increase in rides per alive customer. After three years, when usage is assumed to flatten out, customer churn kicks in again driving a gradual decline in revenues. All told, the net present value of all the future revenue associated with a recently acquired Lyft rider is about $275.
To estimate customer post-acquisition value, we need to multiply these revenues by Lyft’s variable profit margin. Lyft reports Contribution and Contribution Margin metrics, which may seem to be variable profits, but in fact represent gross profits adjusted for amortization, stock-based expense, and changes to insurance reserves. These contribution margin measures ignore other variable costs which we should accounted for, such as Operations and Support and the variable part of G&A.
We make the following assumptions about variable cost margins:
- Cost of Revenue: Lyft has shown a consistent gross margin improvement from 31.4% in Q1 2017 to 45.2% in Q4 2018. In the baseline scenario, we assume they will maintain the latter level going forward.
- Operations and Support: We assume that this is an effectively variable cost needed to support the ongoing operations of the business. In the 2017-2018 period, it fluctuated between 13% and 20% of revenue with a declining trend. We assume it will remain constant at the 2-year average level of 16.6%.
- G&A expense: We assume this is partially fixed and partially variable. Currently, it is about 20% of revenue. We assume that over the next several years it will fall to 10% of sales, which is a typical margin for more mature marketplaces. This long-term expense is assumed to be an effectively variable cost.
- R&D: We consider R&D to be a fixed cost since it seems to be driven by an investment in autonomous vehicles, which should not scale with business growth, even though it will increase in absolute dollars in future periods and may vary from period to period as a percentage of revenue.
Based on these variable profit assumptions and using a 12% WACC, we estimate the post-acquisition value of a recently acquired customer at $51. Netting out the $32 Lyft spends to acquire customers would imply that the CLV of a Lyft rider is $19 per customer, and that Lyft’s return on CAC is roughly 60%. In a more optimistic scenario, if we assume the company will manage to further improve its gross margin to 50% over the next two years, the post-acquisition value jumps to $62, implying a $30 CLV and a 95% return on CAC.
The model also allows us to estimate the CAC payback period. It suggests that it takes about 14 months for a newly acquired customer to generate enough contribution profits to pay for its CAC.
PAV distribution
As we mentioned already, the model implies strong heterogeneity of Lyft’s customer base – there is a significant segment of highly loyal customers who will stay with the company for many years to come and consistently generate profits. It appears that this segment accounts for most of the company’s customer value. We estimate that about 80% of December 2018 customers have a post-acquisition value less than $32 (2018 CAC), therefore have a negative CLV. However, the remaining 20% not only do create value (many of them have CLV upwards of $350), but bring up the average CLV to $19. Had we ignored customer heterogeneity, we would have completely missed this source of hidden value that makes Lyft’s unit economics better than it seems to be on the surface.
At the same time, such heavy concentration of customer value in a relatively small customer segment indicates risk for potential investors – Lyft’s path to profitability will hinge on its ability to retain and develop the segment of its most loyal customers as well as continue acquiring these “power users” in coming years.
Impact of Uber problems in 2017 on Lyft
You may remember a series of problems and scandals Uber faced in 2017. It was very interesting to see that all customer behavior models we built (acquisition, repeat riding, spend) consistently indicated that 2017 was a very positive year for Lyft – customer acquisitions jumped, CAC fell, and rides and revenue improved as well. While we cannot claim causality here, the consistency of improvements across models suggests that Uber’s struggles in 2017 are likely to have boosted Lyft’s business.
Conclusion
Despite the significant financial losses Lyft is currently incurring, running Lyft’s S-1 data through our CBCV model would suggest that Lyft is able to profitably acquire customers, generating $50 to $60 in post-acquisition customer value, well north Lyft’s current $32 customer acquisition cost. The profitability of currently acquired customers is largely driven by strong customer heterogeneity – Lyft’s most loyal customers are expected to stay with the company for many years in addition to increasing platform usage in the first years, generating steady profits over time. The longevity of the most loyal customers makes up for the fact that most of Lyft’s customers churn over the first few months after they have been acquired.
A natural follow-up analysis to this one would be to convert these customer value insights into an overall fair valuation estimate. Even though Lyft turns a variable profit on customers, which will allow it to grow out of its current losses, it still remains to be seen how long it will take for this to happen, and whether the volume of future profits Lyft may generate in the future would justify the healthy valuation they are looking to get in the IPO. This is largely a function of the volume of customers we can expect Lyft to acquire in the future, and how Lyft’s variable profits compare to its fixed cost overhead. We plan on doing in a follow up to this post. (Update: Lyft IPO valuation post is published here)
March 11, 2019
Peter Fader is the author of “The Customer Centricity Playbook” and a co-founder of Theta Equity Partners. Daniel McCarthy is a co-founder and Val Rastorguev is a Director of Theta Equity Partners, a company specialized in Customer-Based Corporate Valuation services — valuing firms by forecasting what their current and future customers will likely do.This article is for informational and educational purposes only, you should not construe any such information or other material as investment, financial, or other advice. Nothing contained in this article constitutes a solicitation, recommendation, endorsement, or offer by Theta Equity Partners to buy or sell any securities or other financial instruments.